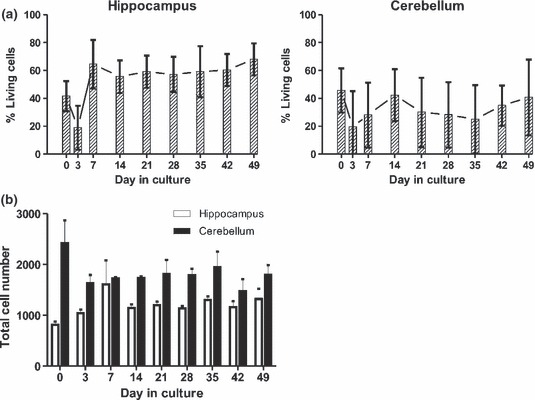
Figure 3.

(a) The average proportion of viable cells as estimated from dead cell and total cell counts are indicated at different time points for hippocampal and cerebellar tissue-slice cultures from six different calves (error bars represent standard deviations). (b) Total cell numbers in 0.6 mm2 of the same hippocampal and cerebellar tissue-slices as in (a) at different time points.
