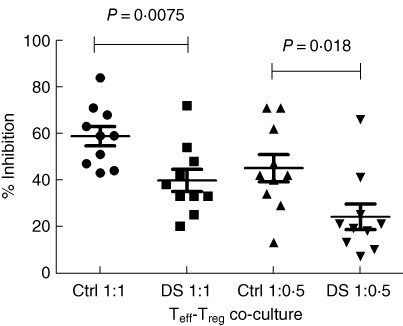
Fig. 4.

Co-culture effector T cell–regulatory T cell (Teff–Treg) median inhibitory rate. In co-culture Teff : Treg 1:1 the median percentage of inhibition by Treg in control subjects was 58·9 ± 4·157%, whereas in Down syndrome (DS) subjects was 39·8 ± 4·788% (n = 10, P = 0.0075); in co-culture Teff : Treg 1:0·5 the median percentage of inhibition by Treg in control subjects was 45·10 ± 5·858%, whereas in DS subjects was 24·10 ± 5·517% (n = 10, P = 0.0177), calculated as described in Materials and methods. One outlier was identified from the DS 1:0·5 Teff–Treg co-culture reference interval data. This data point had a Z-value of 2·40 (P < 0·05), while the critical value of Z for this data set was 2·29. The data were checked and confirmed by a second control; they were not removed because no technical reason was found.
