
Fig. 1.
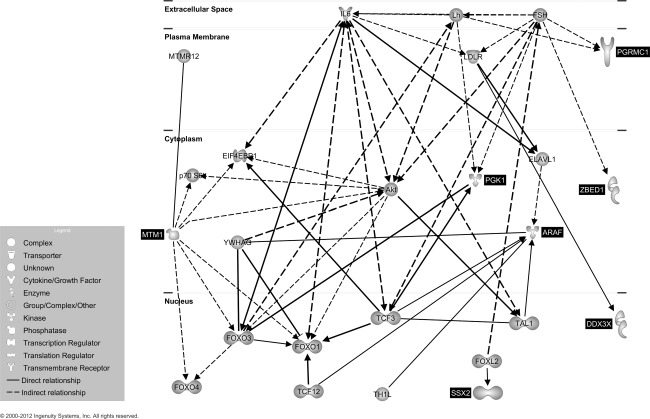
Putative gene network derived from Ingenuity Pathway Analysis (IPA) software analysis. Edges are displayed with labels that describe the nature of the relationship between nodes while lines connecting genes represent known interactions (with solid lines representing direct interactions and dashed lines representing indirect interactions). Nodes are displayed using various shapes that represent the functional class of the gene product (see insert). Black highlighting indicates the seven genes differentially methylated in our analysis and non-highlighted genes are those identified by IPA.