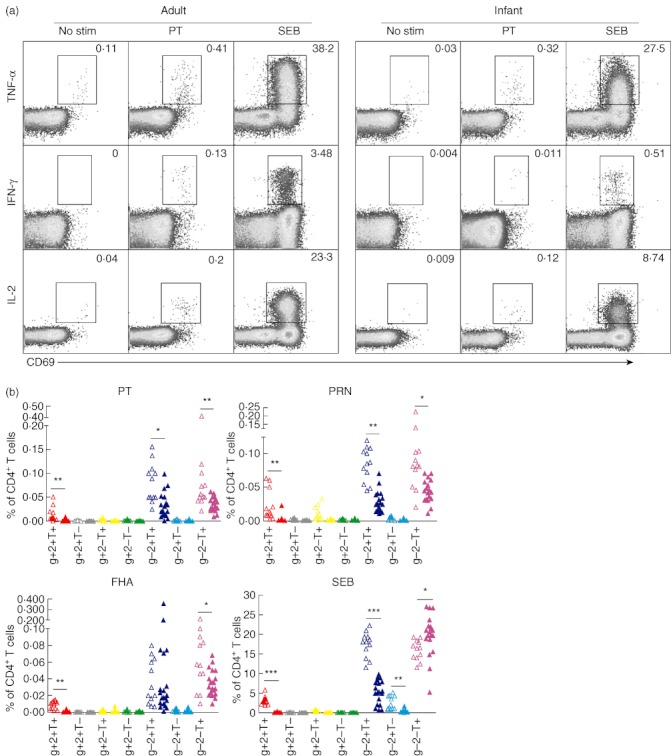
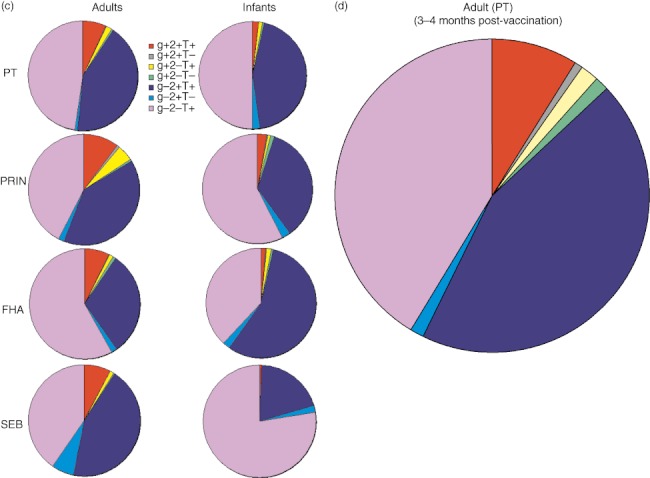
Fig. 3.


Type 1 CD4+ T cell response in infants and adults. (a) Flow cytometry dot-plots show co-expression of early T cell activation marker CD69, with various individual cytokines [tumour necrosis factor (TNF)-α, interferon (IFN)-γ and interleukin (IL-2)] among infants and adults that were gated previously on CD4+ T cells, as described in Fig. 1a. Frequencies of various T helper type 1 (Th1) cytokine combinations generated with Boolean gating were normalized with total CD4+ T cells in the respective samples, background-corrected with unstimulated controls and then presented as a bar graph (described in Methods) Open triangles represent infants while closed triangles represent adults. (b) or pie charts (c) & (d). The bar graphs show mean percentages of CD4+ T cells (all IL-4-) expressing IFN-γ+IL-2+TNF-α+ (depicted as g+2+T+); IFN-γ+IL-2+TNF-α- (g+2+T–); IFN-γ+IL-2-TNF-α+ (g+2–T+); IFN-γ+IL-2-TNF-α- (g+2–T–); IFN-γ-IL-2+TNF-α+ (g-2+T+); IFN-γ-IL-2+TNF-α- (g–2+T–) and IFN-γ-IL-2-TNF-α+ (g–2–T+) among infants and adults. P-values were calculated using the Mann–Whitney U-test; *<0·05; **<0·005; ***<0·0005.
