
Figure 5.
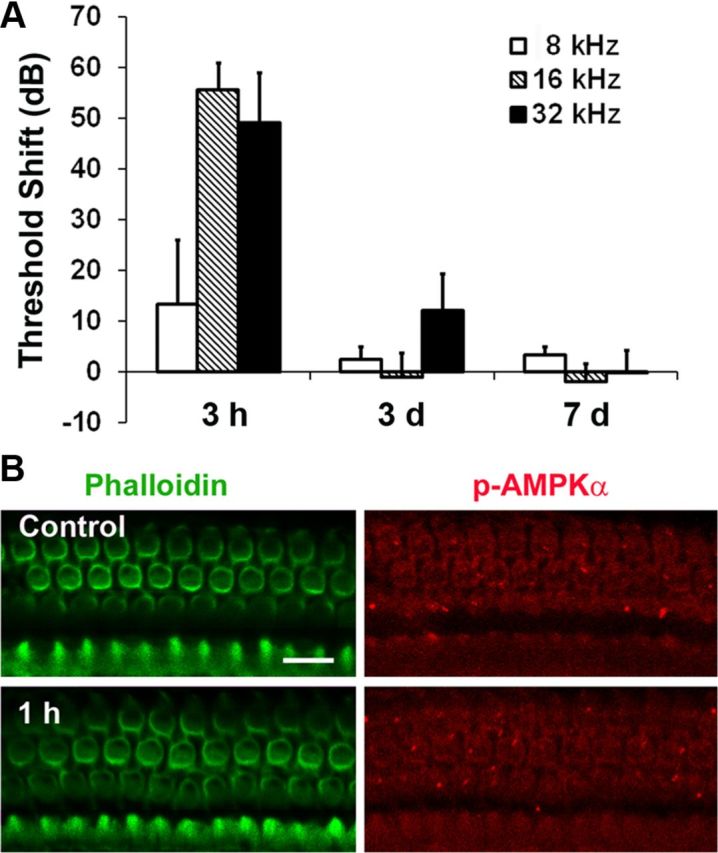
A, Noise-induced TTS. The bar graph represents TTS in 12-week-old male CBA/J mice after exposure to 2–20 kHz BBN at 92 dB SPL for 2 h. Hearing loss recovered completely 1 week after noise exposure. Data are presented as means + SD; n = 5 for each condition; 3 h, 3 d, and 7 d indicate the time after TTS-induced noise exposure. B, Representative images showed no difference in p-AMPKα-associated fluorescence in outer hair cells 1 h post-TTS noise exposure (p > 0.05, n = 3). These images were taken from the upper basal turn of the cochlear epithelium. Scale bar, 10 μm.