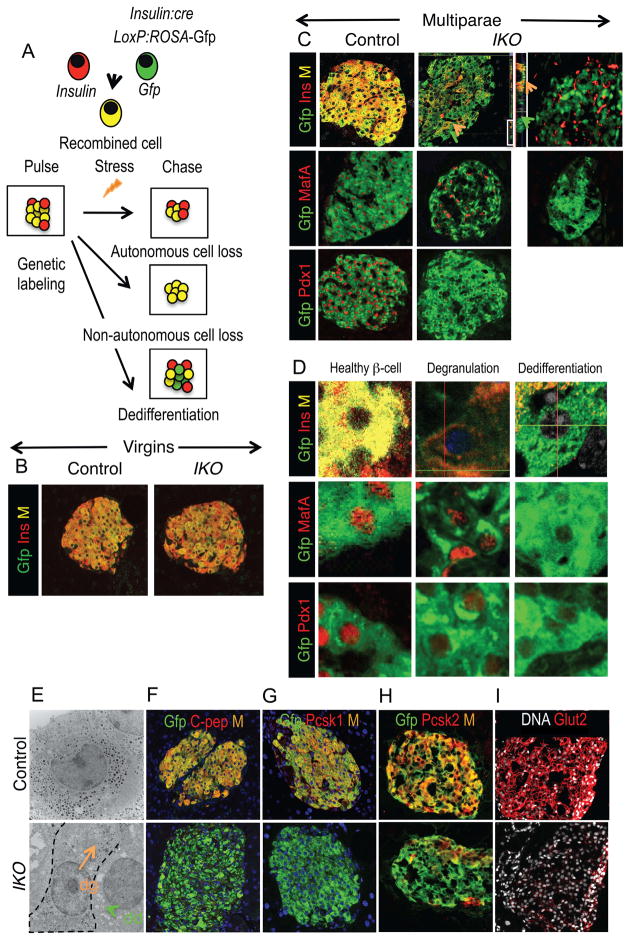
Figure 2. Lineage-Tracing Of β-Cells In Multiparae.
(A) Experimental design and expected outcomes of lineage-tracing experiments.
(B) Immunofluorescence with Gfp (green) and insulin (red) in IKO:RosaGfp and control RosaGfp virgins.
(C) Immunofluorescence with Gfp (green) and insulin, Pdx1, or MafA antibodies (red) in IKO:RosaGfp and control RosaGfp multiparae. Middle and right panels show representative islets with moderate (middle) and extreme degrees (right) of loss of insulin immunoreactivity.
(D) Immunofluorescence with Gfp (green) and insulin, Pdx1, or MafA (red), showing degranulated (orange) and dedifferentiated (green) β-cells inIKO:RosaGfp multiparae (n = 4 for each group).
(E) Electron microscopy showing a representative wild-type β-cell (left) and a degranulated (orange arrow, dg) or a dedifferentiated β-cell (green arrow, dd) in IKO multiparae.
(F–I) Immunohistochemistry with Gfp (green) and Pcsk2, Glut2, Gck, and Pcsk1 (red) in recombined β-cells of multiparous IKO:RosaGfp and control RosaGfp mice. In some sections, DNA is counterstained with DRAQ5 (blue or white). Insets represent individual color channels.
(J) qPCR analysis of Pdx1, MafA, Nkx6.1, NeuroD1, Pcsk2, Gck, and Glut2 in islets isolated from control and IKO mice (n=4 for histology, and n=4 for qPCR). Data show means ± SEM. * = P <0.05, and ** = p <0.01 by Student’s t-test.

