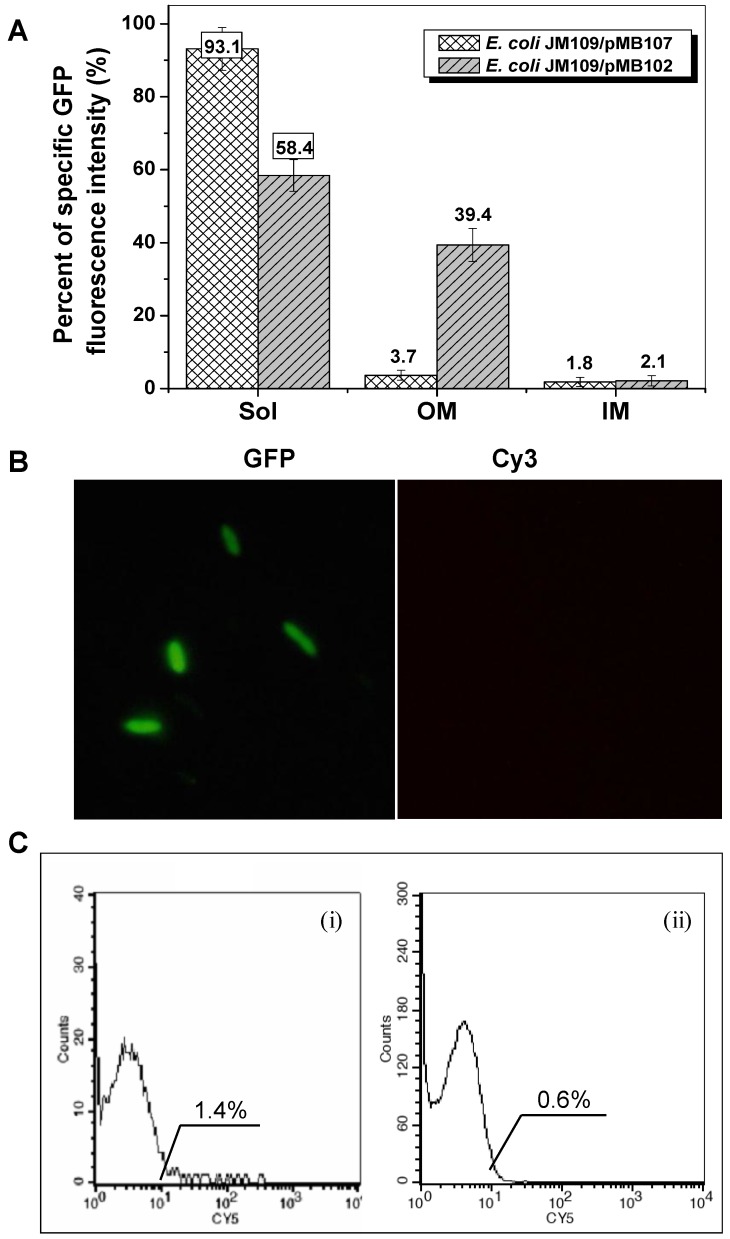
Fig 3.
Expression profiles of E. coli JM109/pMB107 cells expressing InaQ-N′/GFP. (A) GFP fluorescence intensity measurements of subcellular fractions of JM109/pMB107 cells and the control strain JM109/pGFPuv expressing cellular GFP. Sol, soluble cytoplasmic fraction; OM, outer membrane fraction; IM, inner membrane fraction. Each value and error bar represents the mean of three independent experiments and its standard deviation, respectively. (B) Immunofluorescence micrographs of intact JM109/pMB107 cells. Prior to microscopic observation, the cells were treated with monoclonal anti-GFP antibodies, followed with Cy3-conjugated antibodies. (C) Flow cytometric assay of (i) JM109/pMB107 and (ii) JM109/pGFPuv (negative control). Cells were labeled with monoclonal anti-GFP primary antibodies followed with secondary Cy5-conjugated IgG. The value in each histogram indicates the percentage of total Cy5-labeled fluorescent cells.

