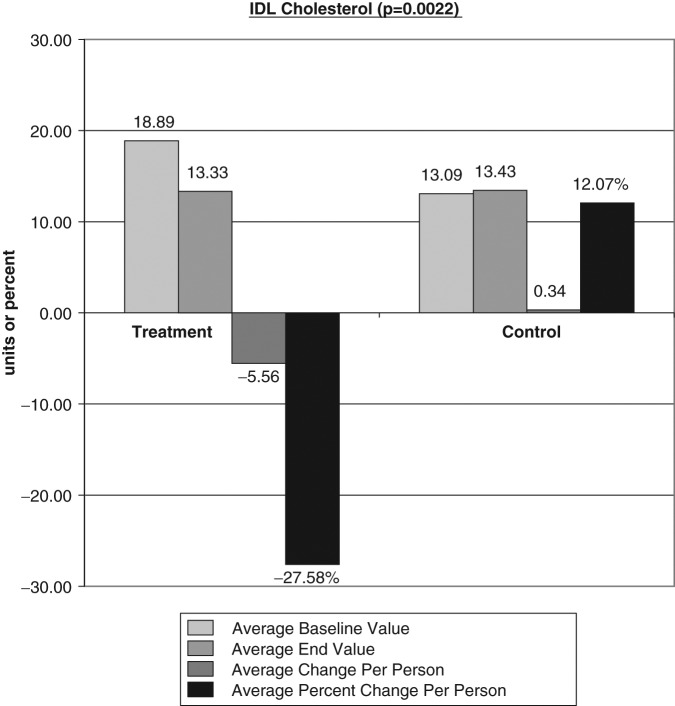
Figure 1.
The average baseline value, final test value, average value change, and average percent changes of Vertical Auto Profile cholesterol panel were calculated comparing the treatment subjects (T) to the control subjects (C) using the unpaired t test. Figure 1 shows a significant decreases in intermediate density lipoprotein average percent change: T = −27.58, C = 12.07.

