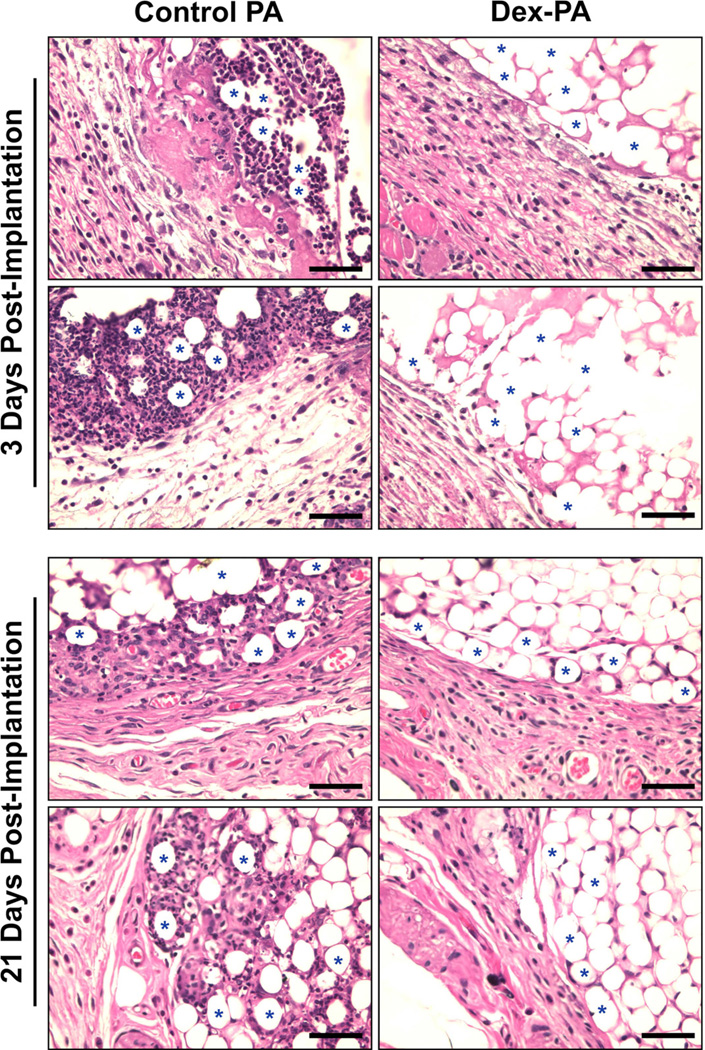
Figure 6.
Representative histology (H&E staining) of tissue harvested either 3 days (top panel) or 21 days (bottom panel) following subcutaneous implantation of polystyrene microparticles delivered within nanofiber gels of control PA (left column) or a 1:9 mixture of Dex-PA and control PA Dex-PA (right column). Blue stars denote some representative particles at the tissue/implant interface and rows correspond to images taken from the same animal. Scale bars indicate 50 µm and images were collected at 40× magnification.

