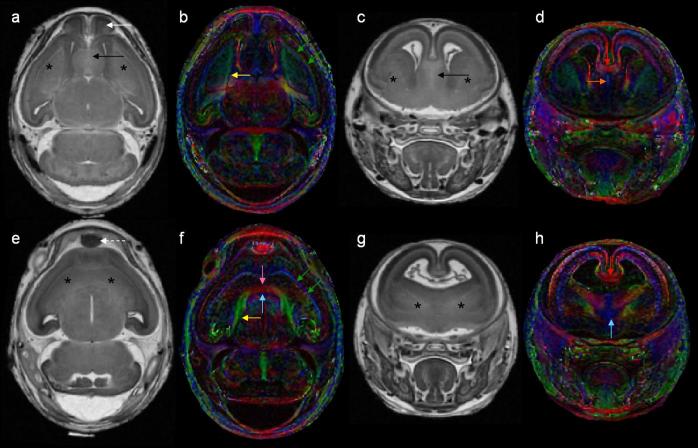
Figure 12.
Non-diffusion weighted images and color-coded fractional anisotropy (FA) maps illustrate normal brain and fiber tract morphology of a control mouse (a-d) and aberrant morphology in a GD7 ethanol-exposed mouse (e-h). As compared to the non-diffusion weighted images of a control mouse (a, c) where the septal region (black arrow), olfactory bulbs (white arrow) and caudate nuclei (stars) appear normal, in the scans of the subject that had been exposed to ethanol (e, g), the olfactory bulbs and septal region are absent and the striatum are too closely approximated. Color-coded FA maps show fiber tract defects resulting from GD7 ethanol exposure (f, h). As compared to the normal appearance of the internal and external capsule in the control (b, yellow and green arrows, respectively), the subject exposed to ethanol prenatally has a significantly thickened internal capsule (yellow arrow) which appears to cross the midline (pink arrow in f). Similarly, the external capsule of the ethanol-exposed fetus also appears to be united across the midline of the brain (green arrows in f).

