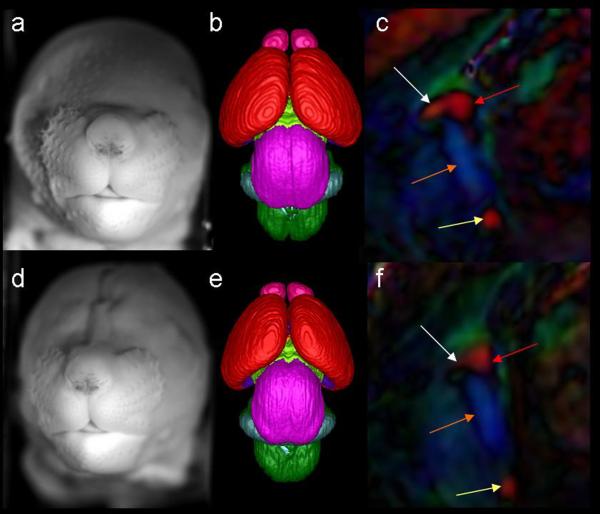
Figure 13.
DTI reveals subtle dysmorphology in a GD 17 fetus following GD7 ethanol exposure. Like the control face (a) and brain (b), those of an ethanol-exposed subject (d, e) appear grossly normal. In the control fetus, color-coded FA maps show a midsagittal section of the brain where the corpus callosum (white arrow), hippocampal commissure (red arrow), fornix columns (orange arrow) and anterior commissure (yellow arrow) are apparent. However, in an ethanol-exposed fetus, the color-coded FA map shows that the corpus callosum of the ethanol-exposed animal (f) appears to be almost completely absent while other fiber tracts appear normal.

