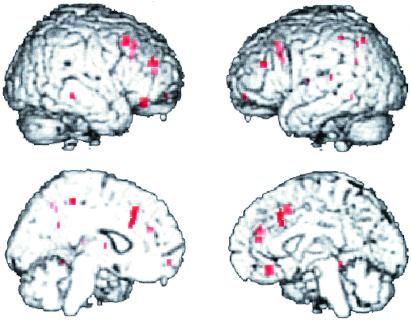
Figure 2.
Effect of COMT genotype on fMRI activation during the two-back working memory task. Regions showing a significant effect of genotype on fMRI activation (voxelwise P < 0.005) are in red (shown clockwise from upper left in right lateral, left lateral, right medial, and left medial views, respectively). In dorsolateral prefrontal cortex (e.g., Brodmann area 46; x = 58, y = 32, z = 12; cluster size = 47; Z = 2.55) and anterior cingulate (e.g., Brodmann 32; x = 6, y = 60, z = 8; cluster size = 77; Z = 2.36), Val/Val individuals showed a greater fMRI response (and by inference, greater inefficiency, as performance is similar) than Val/Met individuals who have greater activation than Met/Met individuals. Post hoc analysis of genotype group contrasts confirmed these significant relationships in dorsolateral prefrontal and cingulate cortices across all groups.

