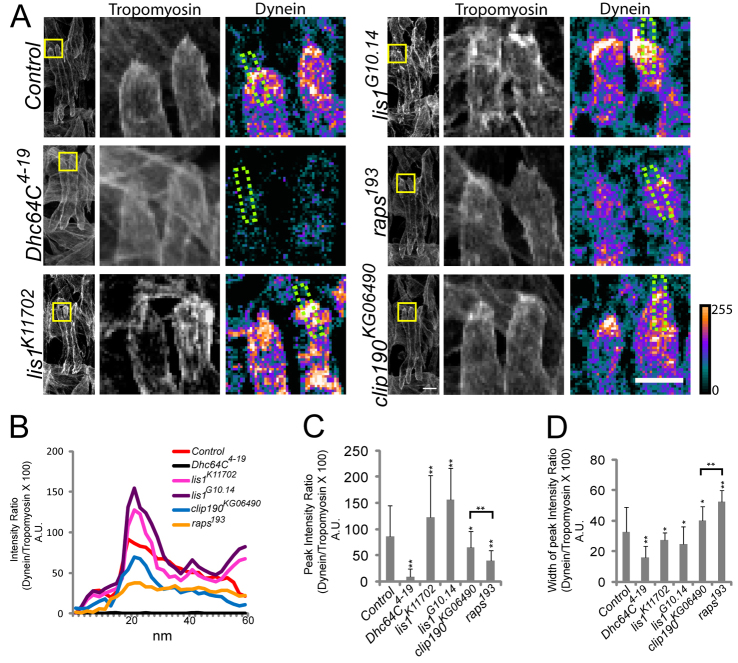
Fig. 6.
Dynein hyperaccumulates in Lis1 mutant embryos. (A) Confocal projections of a single hemisegment from stage 16 Drosophila embryos immunostained for Tropomyosin (green) and Dynein heavy chain (red). The boxed regions are shown at higher magnification to the right, with Tropomyosin shown in grayscale and Dynein shown as a heat map (the scale indicates relative intensity). The regions outlined by the green dotted lines were used for linescan analysis. Scale bars: left-hand panel, 5 μm; right-hand panel, 10 μm. (B) Representative linescan analysis indicating the intensity of Dynein heavy chain immunofluorescence as a function of position across the muscle pole. (C) The peak intensity signal for Dynein heavy chain immunofluorescence in the indicated genotypes. (D) The width of the peak intensity of Dynein heavy chain immunofluorescence. Error bars indicate s.d.; *P<0.05, **P<0.01, compared with control.

