
Fig. 8.
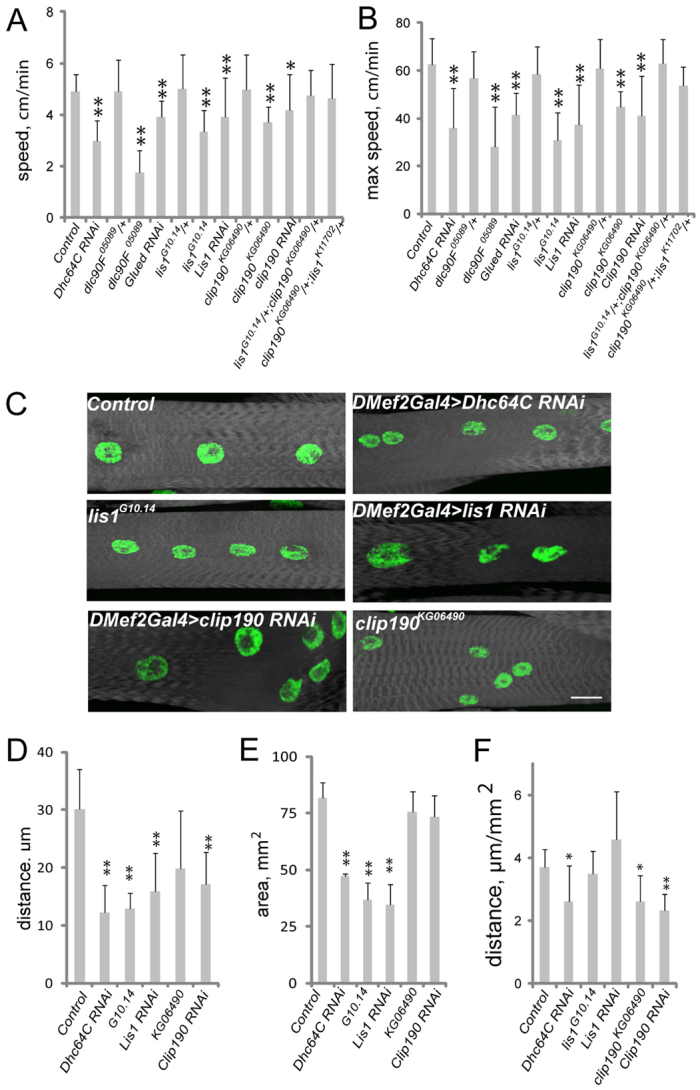
Larval muscle organization and physiology are affected by Dynein and associated proteins. (A,B) The average (A) and maximum (B) speed of Drosophila larvae as they crawl towards a stimulus. (C) Fluorescence images of VL3 muscles from L3 larvae that were used in locomotion assays just prior to dissection. White, phalloidin; green, Hoechst. Scale bar: 20 μm. (D) The average distance between nuclei in larval muscles from the indicated genotypes. (E) The surface area of the muscles in larvae of the indicated genotypes. (F) The distance between nuclei in the larval muscles normalized for muscle size. Error bars indicate s.d. *P<0.05, **P<0.01.