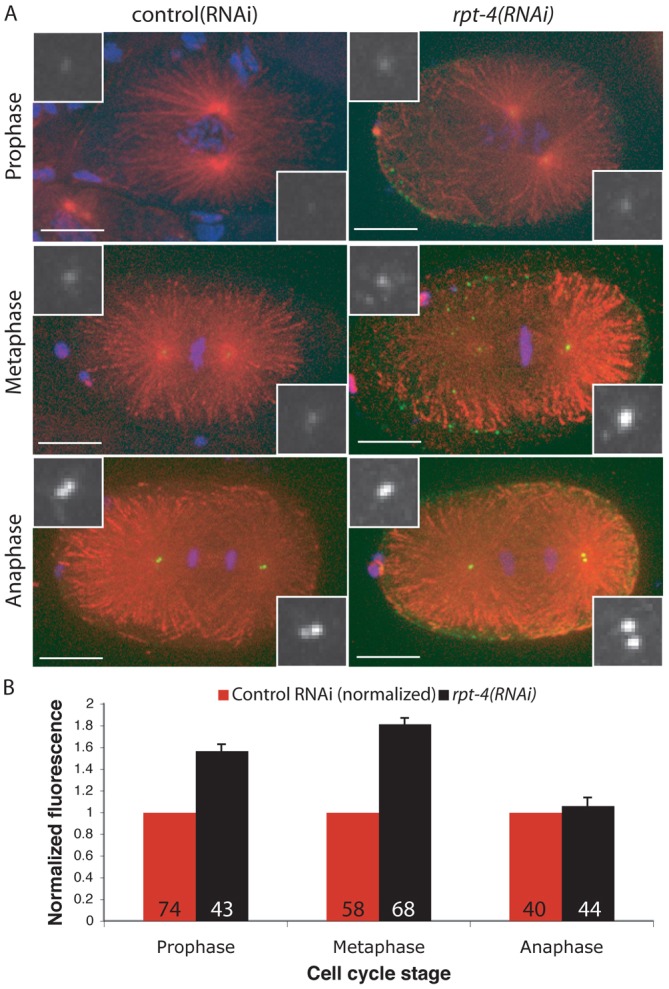
Fig. 2.

ZYG-1 levels are regulated by proteasomal degradation. (A) Representative control (RNAi) and rpt-4(RNAi) embryos stained for microtubules (red), ZYG-1 (green) and DNA (blue). Insets are magnified images of ZYG-1 at the centrosome. Scale bars: 10 µm. (B) Average levels of endogenous ZYG-1 at the centrosome in the one-cell embryo after RPT-4 depletion were quantitated and normalized to control RNAi, which is set at 1 for each stage. The number of centrosomes analysed is indicated. Error bars denote s.e.m.
