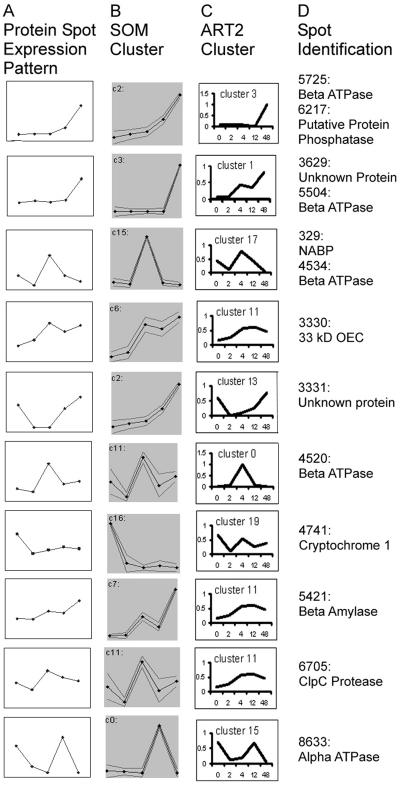
Figure 5.
Comparison of ART2 and SOM clustering methods. A, Protein spot expression patterns from the standard gels for 13 representative proteins from Table II; the x axis is “time point during greening” and the y axis is spot quantity. B, Pattern of SOM assigned cluster for protein. C, Pattern of ART2 assigned cluster for protein. D, Spot identification of each protein (same as the circled spots in Fig. 1).

