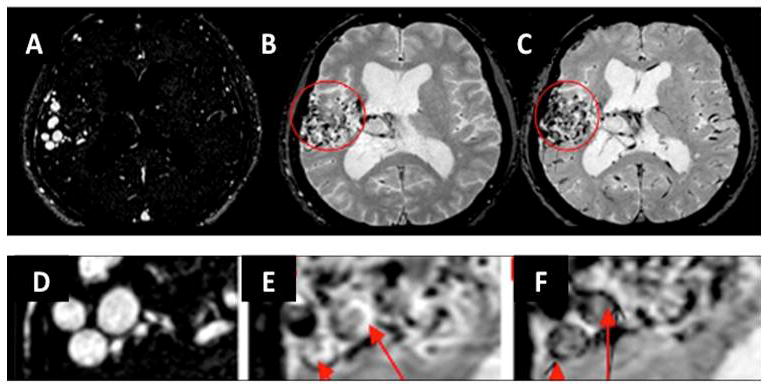
Figure 4. Case D.

A. Select axial image MR angiography, baseline prior to injection
B. Baseline 3D T2*-GE MRI
C. Five days post-ferumoxytol injection T2*-GE MR. Residual intravascular signal loss is present in cortical vessels, although not in sagittal sinus.
D. Magnified view of baseline MRA
E. Magnified view of baseline 3D T2*-GE MRI
F. Magnified view of 5-day post-ferumoxytol injection 3D T2*-GE MRI. Arrows indicate areas of nidus with signal loss within discrete areas of the vascular walls, consistent with uptake of USPIO.
