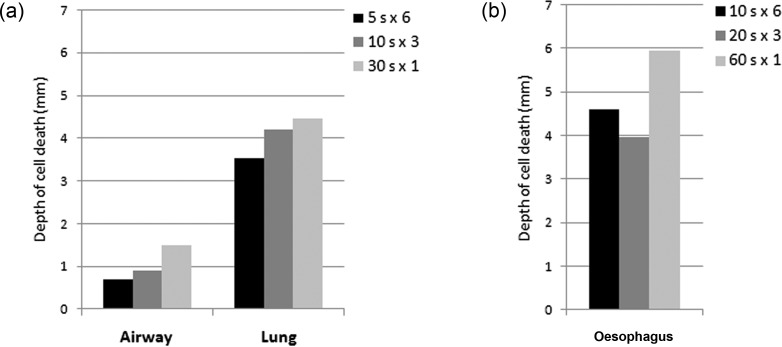
Figure 3:
The depth of cell death with variations in the dosimetry. (a) In spite of maintaining the same total SCT time of 30 s, a longer duration of a spray cycle led to a greater depth of cell death in the airway and lung. (b) Despite the same total SCT time of 60 s, a longer duration of a spray cycle led to a greater depth of cell death in the oesophagus.

