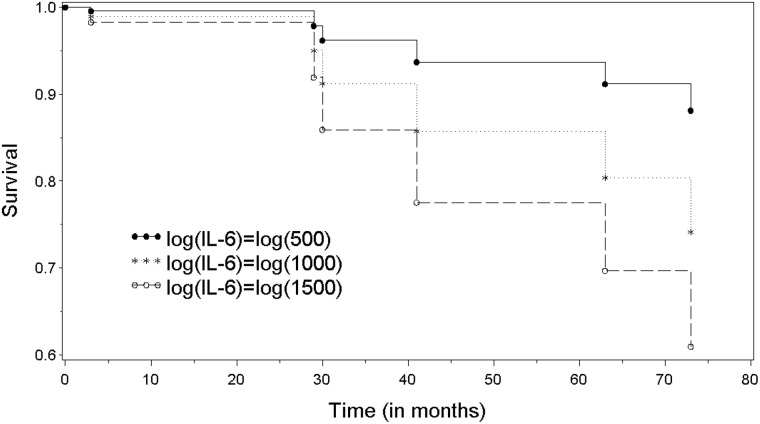
Figure 2:
Kaplan–Meier survival curves for patients with 4-h post-transplant IL-6 levels of >500 pg/ml (solid, n = 19), >1000 pg/ml (dotted, n = 13) and >1500 pg/ml (dashed, n = 7). The correlation between IL-6 and survival time (in months) indicates that higher IL-6 response had shorter survival following transplant (corr = −0.46, log rank P = 0.047).

