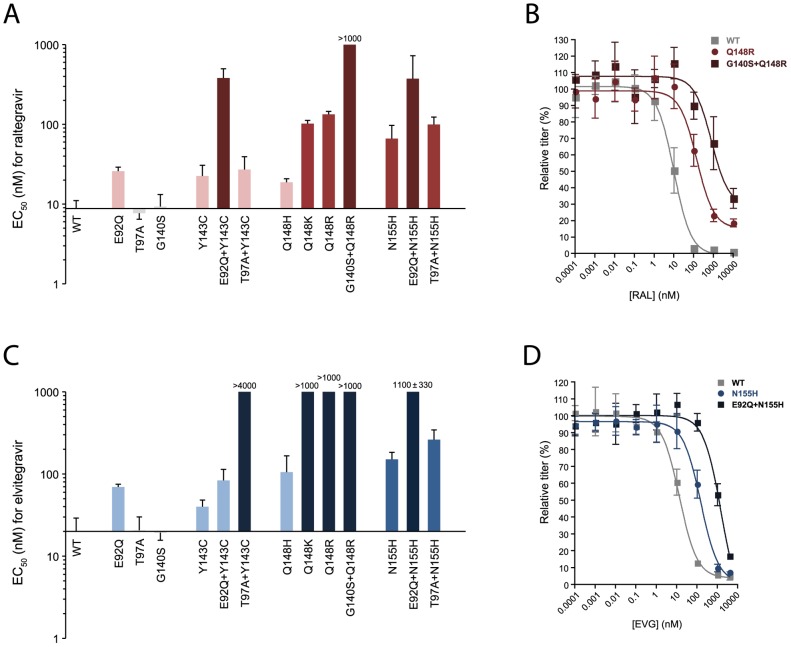
Figure 2. Susceptibility of HIV-2 integrase variants to raltegravir (RAL) and elvitegravir (EVG).
Panels A and C show the EC50 values for wild-type (WT) HIV-2 ROD9 and each of 13 site-directed ROD9 integrase mutants tested against raltegravir and elvitegravir, respectively. Bars indicate the means of three or more independent dose-response experiments. Light, medium and dark-colored bars indicate low-level, moderate, and highlevel resistance (mean EC50 values 2–5-fold, 6–15-fold and >15-fold relative to wild-type, respectively). With the exception of Q148H versus raltegravir and Y143C versus elvitegravir, EC50 values for all strains shown in color were statistically greater than the corresponding values for wild-type ROD9 (P>0.05, ANOVA of log10-transformed EC50 values with Tukey's post-test). EC50 values for T97A and G140S did not statistically differ from WT for either drug. Panels B and D show representative dose-response data for WT, Q148R, and G140S+Q148R versus raltegravir and WT, N155H, and E92Q+N155H versus elvitegravir, respectively. Titers are expressed as the percentage of those seen in the absence of drug (i.e., % of solvent-only controls) and are the means of three independent cultures at each drug concentration. Error bars in all panels indicate standard deviations.

