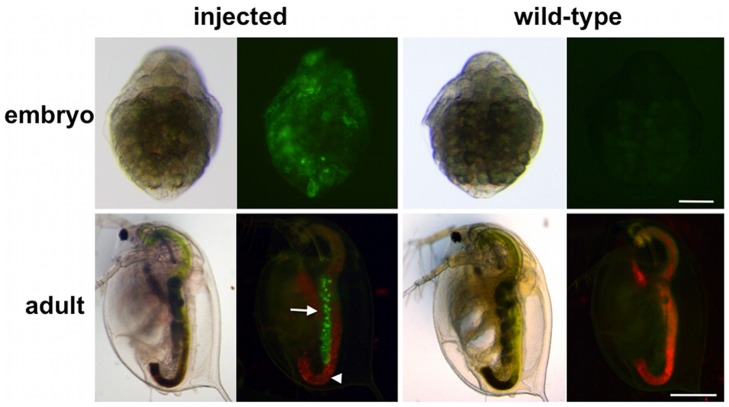
Figure 2. H2B-GFP expression in G0 transgenic animals.
Upper and lower columns show embryos 27 h and adults 7 days after ovulation. Images were taken from the same sample under a bright-field microscope (left image) and a fluorescence microscope (right image). Left and right columns represent injected and wild-type animals, respectively. Wild-type animals show weak green autofluorescence. Red fluorescence, mainly detected in the gut that extended the body from anterior to posterior, is autofluorescence of chlorella, which is feed for daphnids. Arrows and arrowheads indicate ovaries and guts. Scale bar: 100 µm in the upper column; 500 µm in the lower column.

