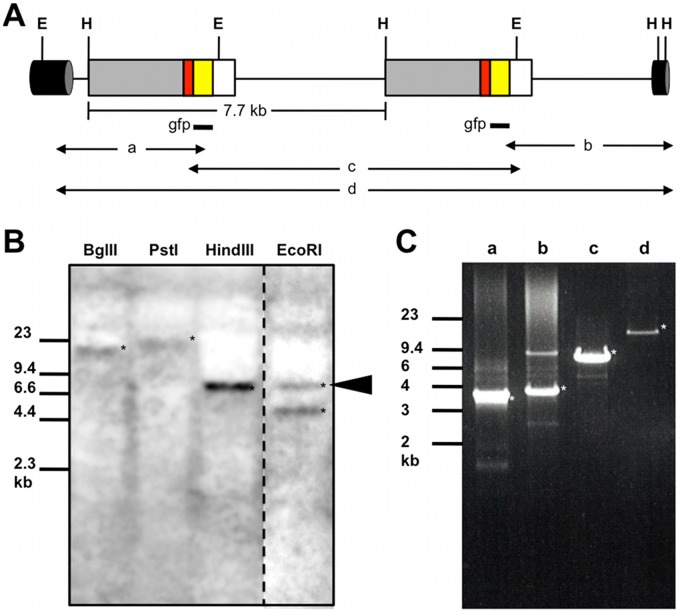
Figure 3. Characterization of the transgene structure.
(A) Simplified diagram of the integrated transgene. Two copies are shown in a head-to-tail array. Grey, red, yellow, and white boxes indicate the EF-lα-1 promoter–enhancer region, H2B coding region, GFP coding region, and EF-lα-1 3′UTR, respectively. A cylinder shows chromosome DNA surrounding the transgene. Regions to be hybridized by the gfp probe were indicated as black bars. a, b, c, and d, indicate fragments amplified by PCR to confirm the structure of the transgene (see Figure 3C). EcoRI (E) and HindIII (H) sites outside the transgene were found in sequences of genomic contig42228 and scaffold466. (B) Southern blots of DNA hybridized with the gfp probe. An arrowhead indicates a 7.7 kb band whose length is the same as that of plasmid DNA. (C) PCR to confirm the transgene structure. Amplified genomic DNAs were resolved by agarose gel electrophoresis. Asterisks indicate DNA fragments from the integrated transgene. Migration of markers with lengths indicated (kb) is shown at the left.

