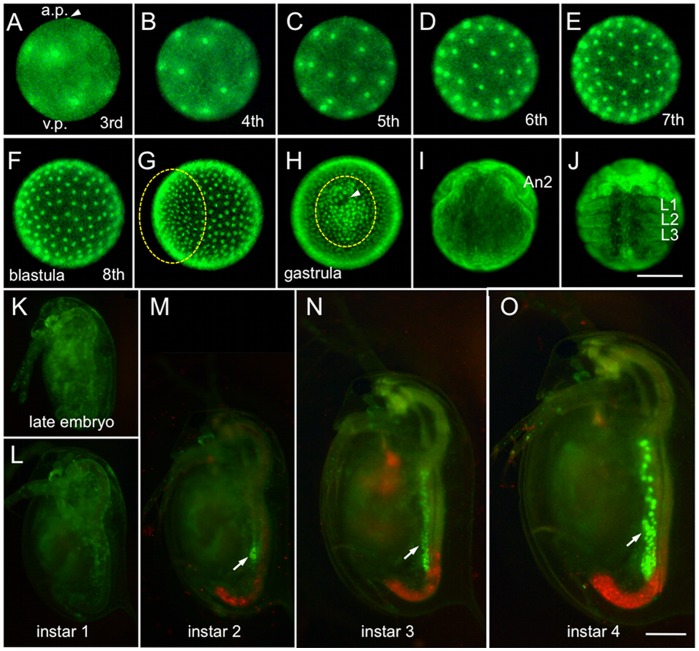
Figure 4. Visualization of embryogenesis and oogenesis.
(A–F) The third to eighth cleavage stage for blastula formation. The egg has polarity. The upper side is the animal pole (a.p.); the lower side is the vegetal pole (v.p.). An arrowhead indicates the polar body. A blastula was formed 3 h 20 min after ovulation. (G) Early gastrulation (4 h 40 min after ovulation). (H) Late gastrulation (5 h 40 min after ovulation). Ventral views and anterior upwards. An arrowhead indicates a pit produced by invagination of the genital rudiment. Cells that migrate to the region to be the ventral side are circled by a dotted line. (I) Cephalic appendage developing stage (11 h 40 min after ovulation). (J) Early thoracic appendage developing stage (16 h after ovulation). Ventral view and anterior upwards. An2 second antenna, L1–L3 first to third thoracic segments. (K–O) Development between late embryonic and fourth instar stage. Lateral views with ventral to the left and anterior upwards. Arrows indicate fluorescence of H2B-GFP in ovaries. Red fluorescence is autofluorescence of chlorella. Scale bar: 100 µm in A–J; 250 µm in K–O.

