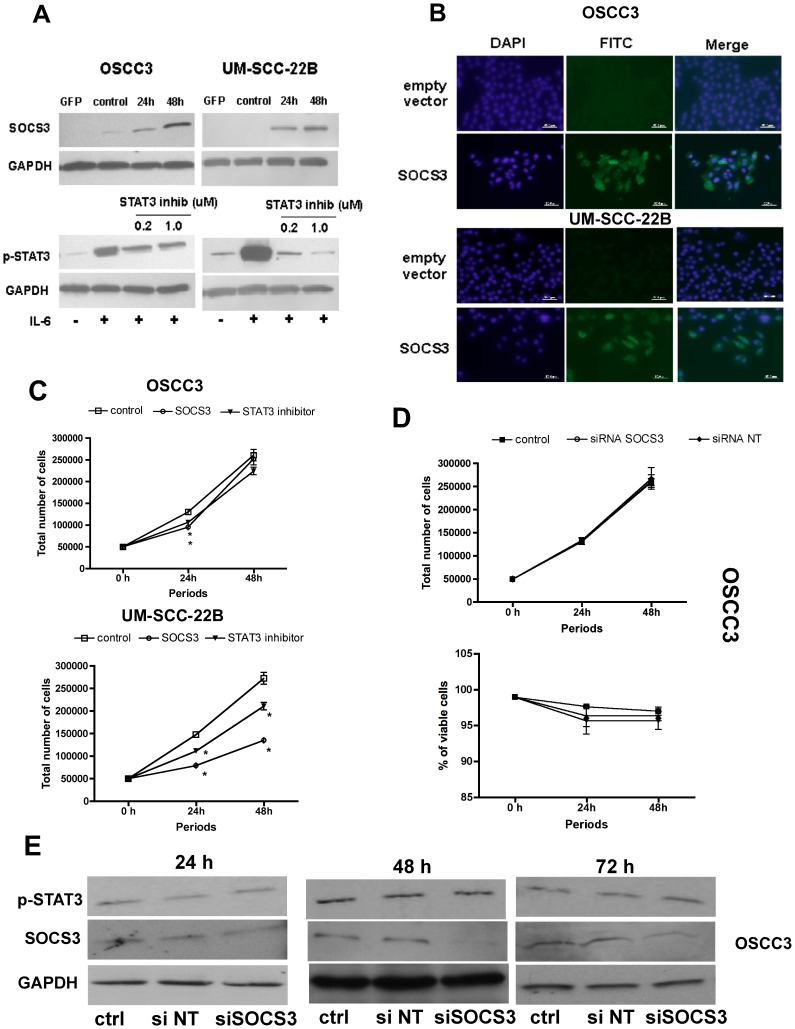
Figure 3. Modulation of SOCS3 expression in gain and loss of function experiments in HNSCC only reduces proliferation of cells without (UM-SCC-22B) detectable levels of endogenous SOCS3.
(A) Immunoblot analysis of whole cell extracts shows that transfection of the SOCS3 expression plasmid resulted in increased levels of SOCS3 after 24 and 48 h in OSCC3 and UM-SCC-22B cells. Pre-treatment of both cell lines with the indicated concentrations of the biochemical inhibitor effectively decreased phosphorylation of STAT3 30 min after stimulation with IL-6 (25 ng/mL). (B) Subcellular localization of SOCS3 in the overexpression experiments was confirmed by immunofluorescence analysis. Images are representative of three independent experiments assessing SOCS3 transgene expression 48 h after plasmid transfection. (C) Cell proliferation was determined by direct counting the cells and the trypan blue dye exclusion test 24 and 48 h after transfection. (D) Cell proliferation was also determined in loss of function experiments by direct counting of cells using trypan blue exclusion test 24 and 48 h after siRNA transfection in OSCC3 cells. Graphs (C and D) represent growth curves (number of viable cells) over time, according to the experimental condition (in C: transfection of empty vector, SOCS3 expressing vector, or treatment with STAT3 inhibitor; in D: reagent control, SOCS3 siRNA and non-target control siRNA). Vertical lines standard deviations of three independent experiments and * indicates p<0.05 for comparison with vehicle control (empty vector or non-targeting siRNA in gain and loss of function experiments, respectively). (E) Immunoblot analysis verifying the efficiency of siRNA-mediated inhibition of endogenous SOCS3 expression 24, 48 and 72 h after transfection. Images are representative of three to five independent experiments.

