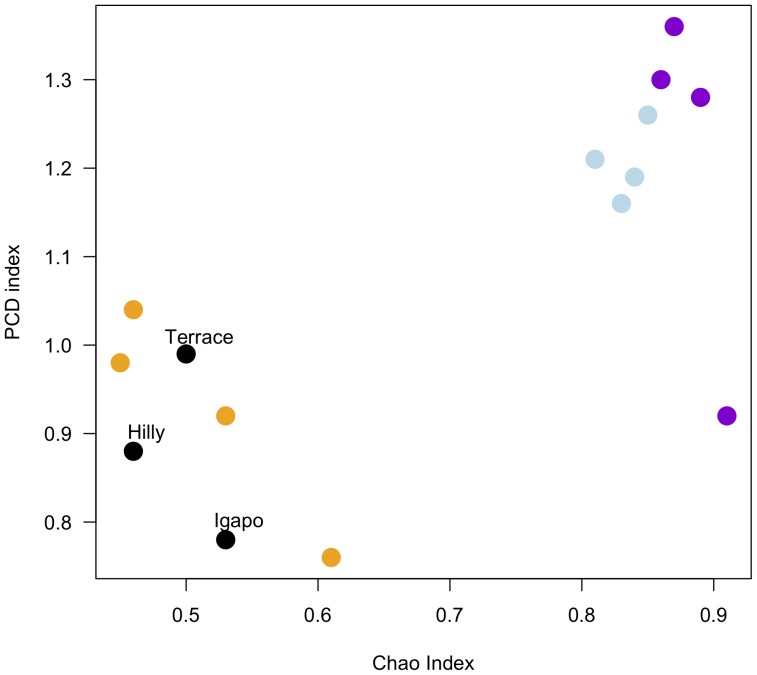
Figure 4. Pearson’s correlations between Chao and PCD indices.
The orange dots represent coefficients calculated for Hilly and Terrace plots, blue dots represent coefficients calculated for Terrace and Igapó plots, and violet dots represent coefficients calculated for Igapó and Hilly plots. Black dots represent the coefficients for plots from the same landscape unit.

