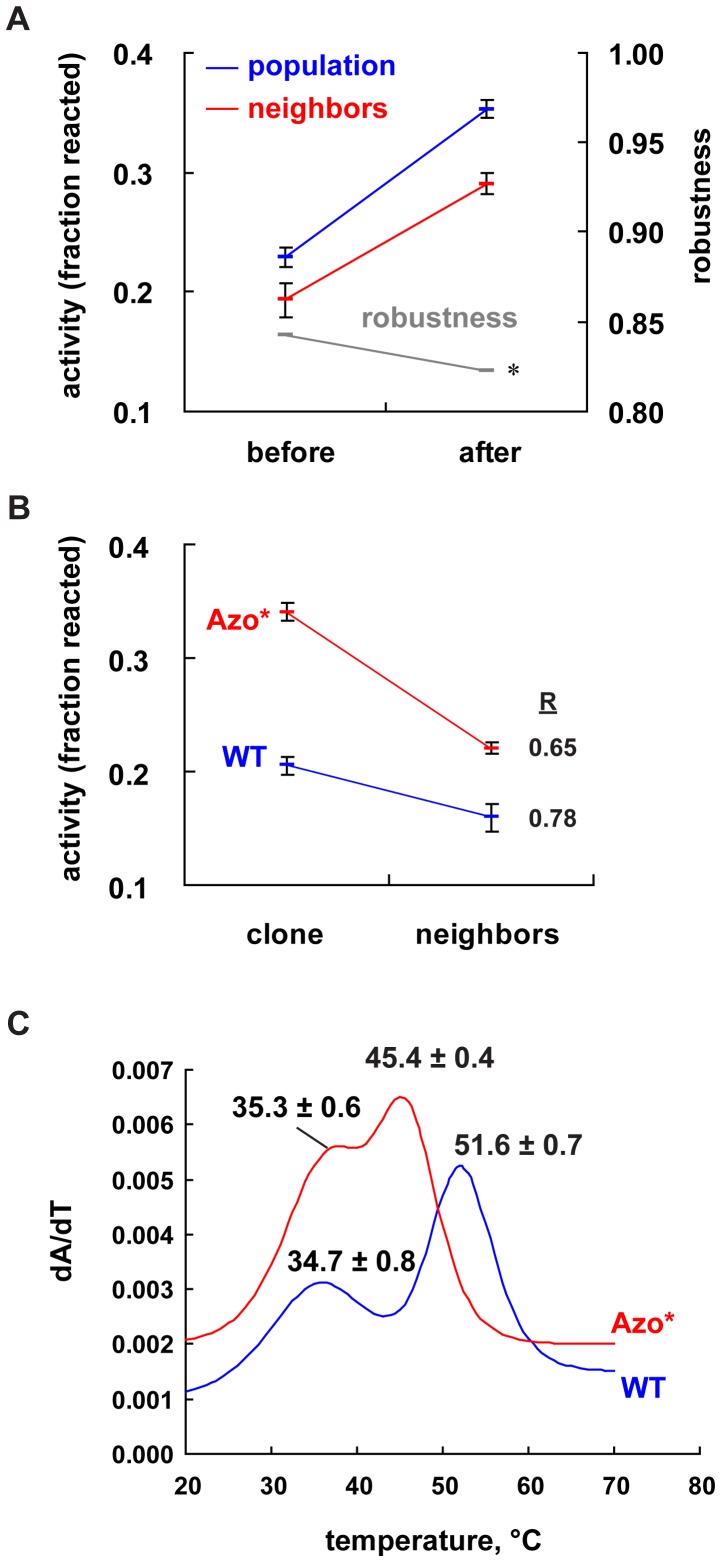
Figure 1. Evidence of decanalization.
Activities are measured as the fraction of the ribozyme sample that reacts under our experimental conditions (1h at 37°C, 25 mM MgCl2, 30 mM EPPS pH 7.5). Error bars represent 95% confidence intervals. (A) The activities are shown for ribozyme samples taken before and after directional selection. Samples were prepared with high-fidelity PCR (“population”, blue) or with a mutagenic PCR protocol (“neighbors”, red). Robustness is calculated as the ratio of the neighbors’ activity to the population activity at each time (grey). The asterisk indicates that the decrease in robustness is significant (P = 0.016). (B) Mutational robustness of the Azo* (red) and wild-type (“WT”, blue) genotypes. Robustness R is measured as the ratio of the activities of the neighbors to the clones for each genotype. (C) Evidence of decreased environmental robustness (thermodynamic stability) of the Azo* genotype. UV absorbance was measured in 10 mM sodium cacodylate buffer (pH 7.5). The plot shows an example of the best-fit curve to data plotted as a derivative of the UV-absorbance (dA/dT) as a function of temperature (°C) for the Azo* (red) and wild-type (blue) ribozymes. The values above each peak indicate the mean and 95% confidence intervals from at least seven replicates (eight for Azo*). Curves were produced using the program Global Melt Fit (http://www.jhu.edu/~chem/draper).

