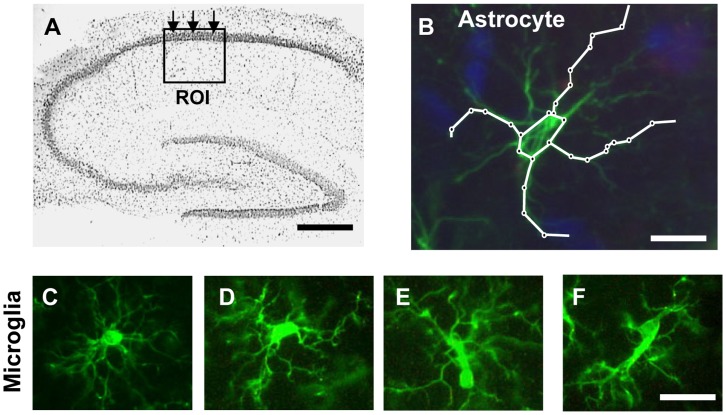
Figure 1. Methods: ROI, scheme of measure of astrocytes branches lenght, examples of resting-reactive microglia.
A: localization and dimensions of the Region Of Interest (ROI) utilized to perform the quantitative analysis; scale bar: 500 µm. B: schematic diagram showing the method used to quantify principal astrocytes branches length; scale bar: 15 µm. C–F: different stages of microglia activation. C: a typical example of a resting microglia cell; D–F: typical examples of microglia in reactive states; scale bar: 20 µm.

