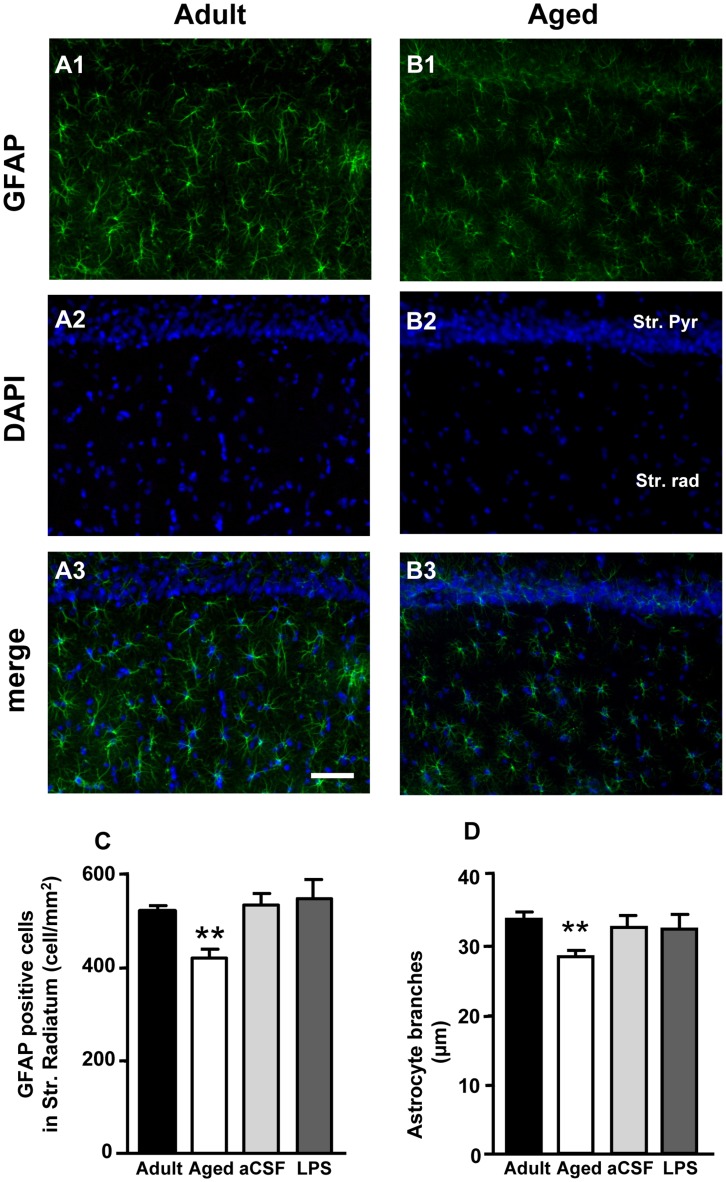
Figure 3. Quantitative analysis of astrocytes in CA1 Str. Radiatum.
Characterization of astrocytes in CA1 Str. Radiatum of adult and aged rats. Representative epifluorescent photomicrographs showing immunoreactivity of GFAP (green) and DAPI staining (blue) in CA1 Pyramidal cell layer and Str. Radiatum of adult (A1,A2,A3) and aged (B1,B2,B3) rats. A3 and B3 show the merged images. Scale bar: 50 µm. C: quantitative analysis of GFAP positive cells counted in CA1 Str. Radiatum of adult (n = 12), aged (n = 15), aCSF- (n = 5) and LPS-treated (n = 6) rats, expressed as GFAP positive cells/mm2 (mean±SEM); **P<0.01 vs all other groups. D: length of principal astrocyte branches in CA1 Str. Radiatum of adult (n = 12), aged (n = 15), aCSF- (n = 5) and LPS-treated (n = 6) rats; (mean±SEM), **P<0.01 vs all other groups.

