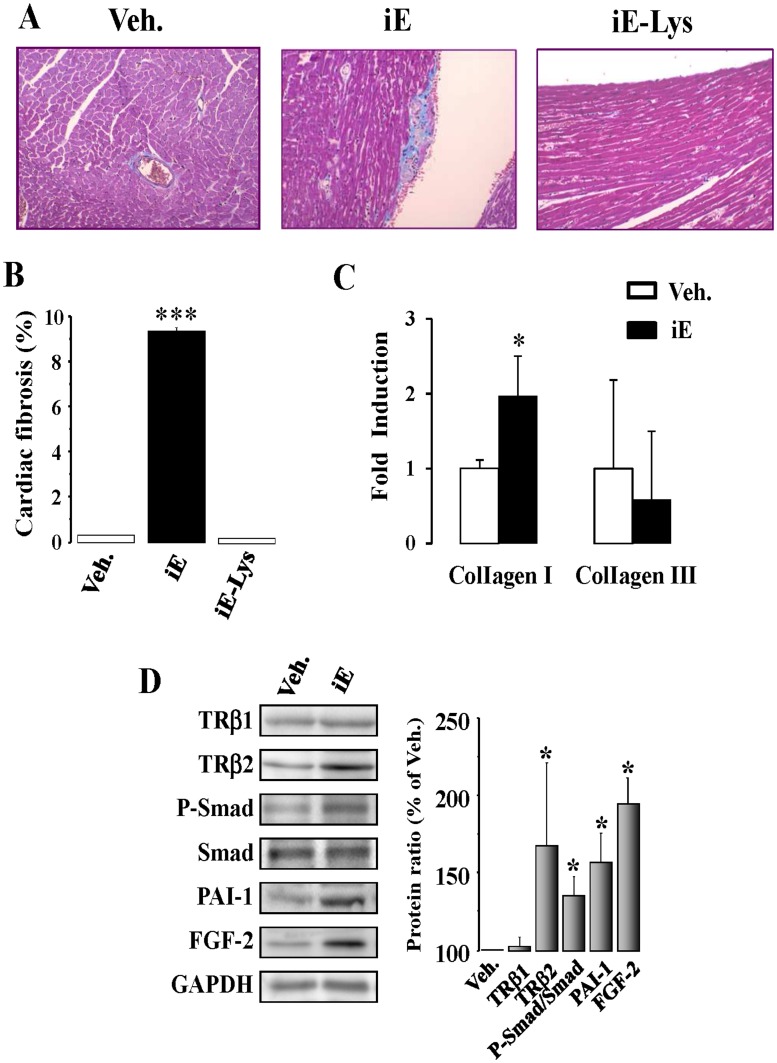
Figure 3. NOD1 activation increases cardiac fibrosis and TGF-β pathway in hearts isolated from iE treated mice.
(A) Histological analysis of the hearts from mice treated with vehicle (Veh.), with 150 µg of iEDAP (iE) or with 150 µg of iE-Lys (NOD1 inactive analogue of iEDAP). Representative whole-heart cross-sections are shown (magnification x20). Myocardial fibrosis was evaluated after staining with Masson’s trichrome. (B) Histograms show the quantitative analysis of subendocardial fibrosis is shown as collagen area vs. total tissue area (100%, mean ± SEM; n = 4 animals per condition). (C) Histograms show type I and III collagen mRNA levels in cardiac tissue from iE and Veh. treated mice. (D) TGF-β signaling was activated in hearts from iE-treated mice. Left panel, representative blots of TRβ1, TRβ2, P-Smad, Smad, PAI-1 and FGF-2 of vehicle and iE treated mouse hearts (150 µg for 2 weeks). Right panel, shows the corresponding histograms representing the mean values vs. vehicle (100%, n = 4–6 animals). GAPDH was used to normalize all the target protein levels. *p<0.05, ***p<0.001 vs. vehicle.

