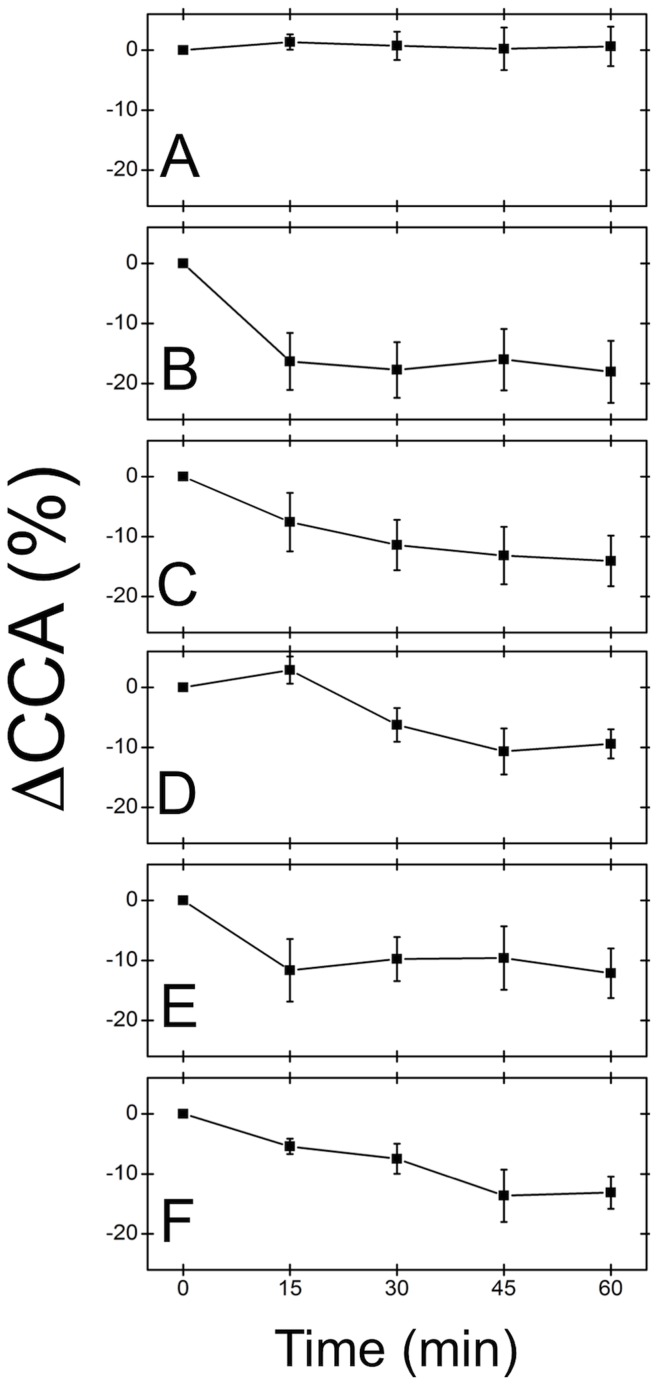
Figure 4. Dynamic changes in C2C12 close contact area over 60 mins.
Cells were treated with various inhibitors and IRM images were acquired every 15 mins for 60 mins. (A) Control, (B) Cyt-D, (C) nocodazole, (D) Y-27632A, (E) ML-7 and (F) blebbistatin treated cells (n = 3 cells for each condition). In each case, except for the control, a significant decrease in contact area occurs after 60 mins of exposure to each inhibitor. However, there was no statistically significant dependence on the type of inhibitor used. On average, the ΔCCA was ∼13% for each condition, except for the control.

