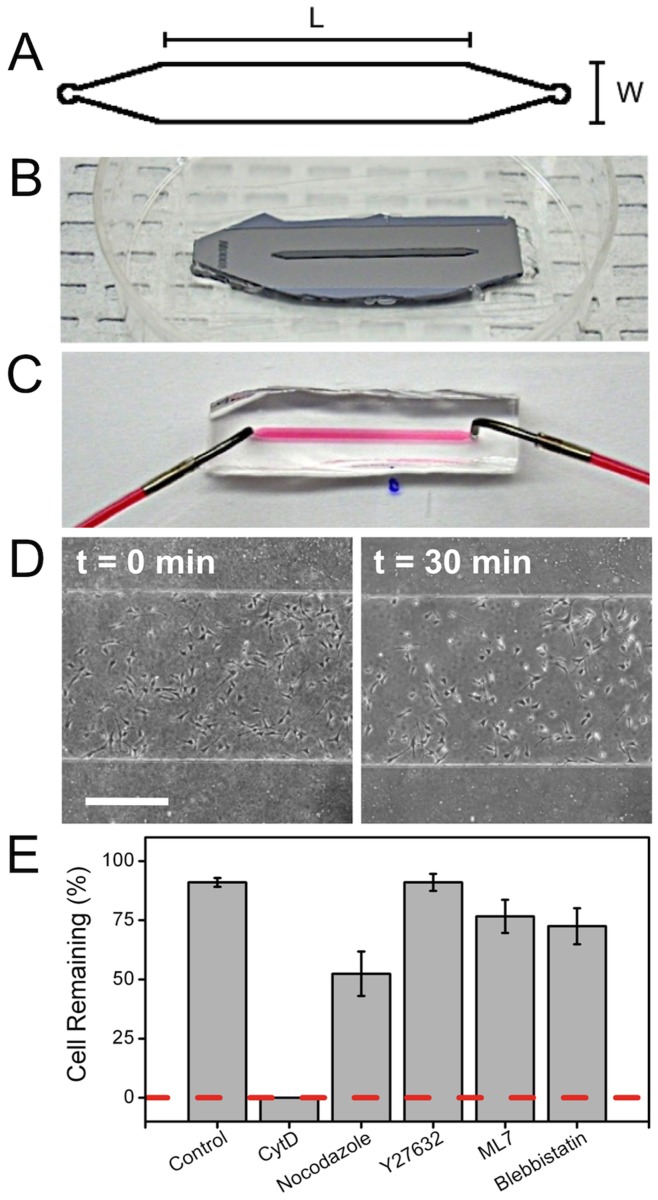
Figure 5. Flow chamber adhesion assay and changes in cell adhesion strength.
(A) In face flow chamber dimensions: L = 2 cm and W = 1 mm. (B) SU-8 master used to fabricate flow chamber with a height of 160 µm. (C) Water with red dye shows the flow chamber working principle with bent stainless steel needle attached to the inlets and outlets allowing media to be pumped through the chamber. (D) Typical adhesion assay where cells were exposed to shear stress over a period of 30 min. Cells were counted before and after flow to quantify changes in cell-substrate adhesion strength (scale bar = 500 µm). (E) Bar graph showing the ratio of cells remaining on the glass substrate after exposition to a shear stress of 65 Dyne/cm2 over a period of 30 min. There is no significant difference between the control and Y27632 treatment (p>0.1). All other treatments yield a significant decrease relative to the control (p<0.04).

