
Figure 7. Fixed and stained images of ß1-integrin and the membrane of C2C12 cells.
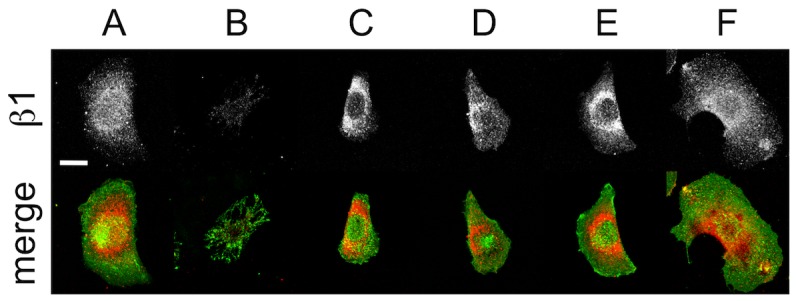
Cells were exposed to inhibitors for 60 min and then fixed and stained for the presence of β1-integrin (greyscale and red in the merge) and the plasma membrane (green in the merge). LSCM images were acquired at the cell-substrate interface. (A) Control (scale bar = 20 µm and applies to all), (B) Cyt-D, (C) nocodazole, (D) Y-27632A, (E) ML-7 and (F) blebbistatin treated cells. In all cases, integrin-ß1 is well distributed over the cell contact area. However, after 60 min of CytD treatment a significant decrease in integrin-ß1 was observed, correlating to a significant decrease in cell adhesion strength (Fig. 5).