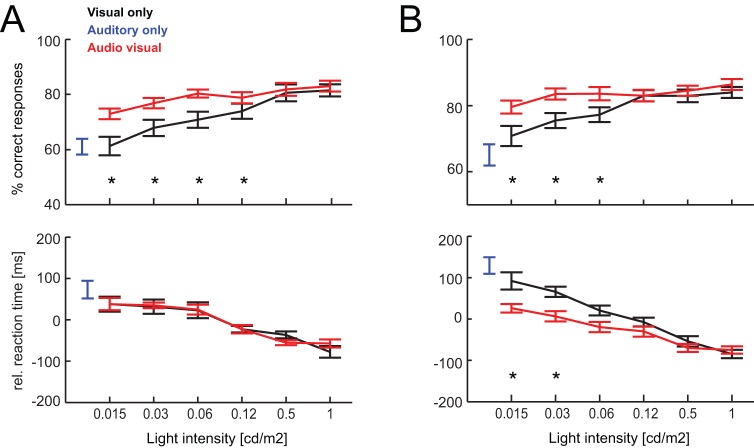
Figure 2. Behavioral performance – main paradigm.
Behavioral performance (% correct responses, upper panel) and reaction times (lower panel) for each condition and as function of visual target intensity. Error-bars denote the mean and s.e.m. across animals (n = 8). Reaction times were normalized by subtracting each animals mean reaction time (computed across all conditions). Stars indicate statistical significance (ANOVA p<0.05). The data in A) were obtained after 10 days of training, those in B) after 25 days. Note that reaction times (e.g. for the visual condition) in B appear slower compared to A because of the normalization. Actual values for the visual conditions were comparable while those for the audio-visual conditions were shortened in B (c.f. data presented in the main text).

