
Figure 3. Behavioral performance – controls and additional paradigms.
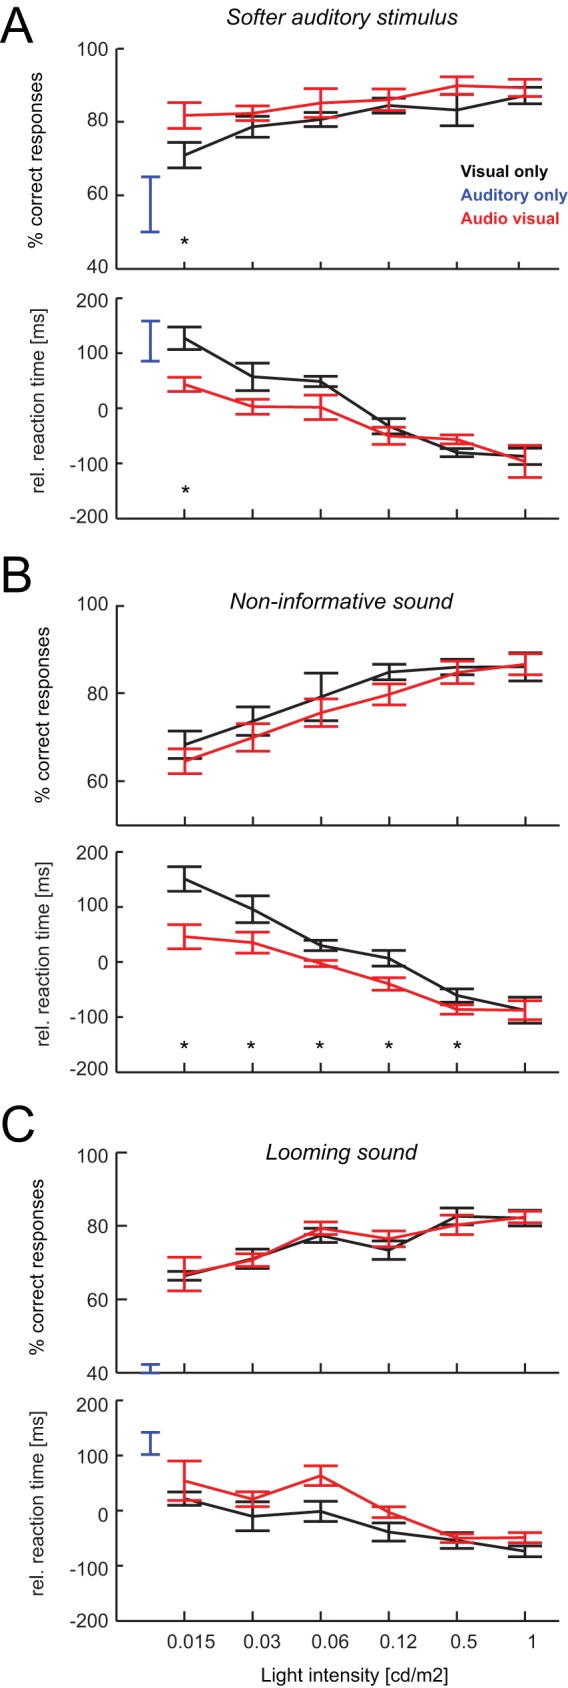
Behavioral performance (% correct responses, upper panel) and reaction times (lower panel) as in Figure 2 (n = 4 animals each). Stars indicate statistical significance (ANOVA p<0.05). A) Paradigm with a softer auditory stimulus (65 dB). B) Paradigm with a non-informative sound, hence no auditory performance level. C) Paradigm using looming sounds instead of white noise.