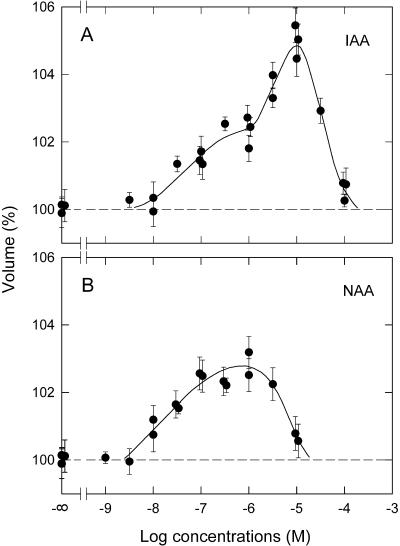
Figure 2.
Dose response curves for the protoplast swelling induced by IAA (A) and NAA (B). Experiments were carried out as described for Figure 1. The relative protoplast volume at 90 min after auxin application was plotted. The means from 30 to 55 protoplasts, each obtained from a single experiment, are shown (vertical bar = ±se). Although the auxin concentrations were separated by 0.5 log units, some of the points are displaced laterally to avoid their overlapping. The curves were fitted by eye.

