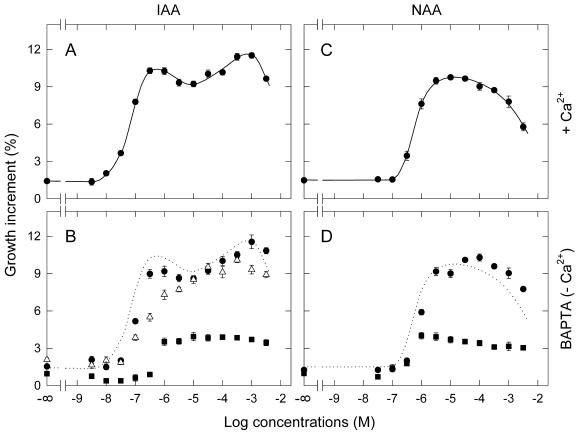
Figure 8.
Dose response curves for IAA- and NAA-induced growth of pea internode segments. A and C, Dose response curves for the growth induced by IAA and NAA, respectively, in the presence of 1 mm Ca2+. The curves were fitted by eye. B and D, Dose response curves for the growth induced by IAA and NAA, respectively, in the absence of Ca2+ and in the presence of 1,2-bis(2-aminophenoxy)-ethane-N,N,N′,M′-tetraacetic acid (BAPTA) at 1 (•), 3 (▵), and 10 (▪) mm. The dotted lines reproduce the curves in A and C. Segments were treated with IAA or NAA for 2 h after 2-h pre-incubation without auxin. The ordinate indicates the increment in length, calculated as the percent of the initial length. Each point is the mean from eight to 16 segments (vertical bar = ±se). The se is not seen when smaller than the symbol size. The initial lengths in millimeters (mean ± sd) of all analyzed segments were 5.131 ± 0.086 (with Ca2+), 5.191 ± 0.065 (1 mm BAPTA), 5.164 ± 0.086 (3 mm BAPTA), and 5.122 ± 0.068 (10 mm BAPTA).

