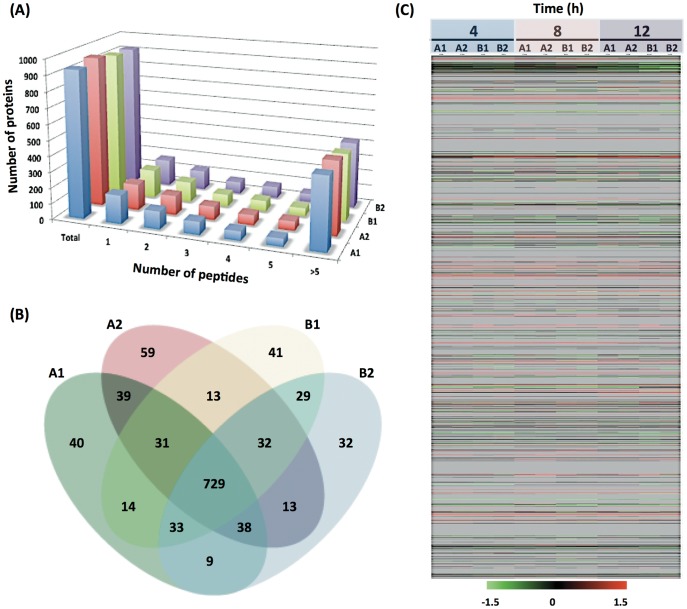
Figure 3. Overview of the iTRAQ results.
(A) Number of distinct peptides identified in a protein. The peptides were identified using Mascot Daemon software with a 95% confidence level. About 17–19% of proteins were identified by single peptides. More than 80% of proteins were identified by at least two peptides. Approximately 47% of proteins were identified by more than 5 peptides. (B) Comparison of protein identification in iTRAQ experiments. Venn diagram shows the comparison of protein identification between biological replicates (A versus B) as well as technical replicates (A1 versus A2 and B1 versus B2). There were 207 proteins identified in a single experiment and 217 proteins identified in two or three of the experiments. A total of 728 proteins were identified in all four experiments. (C) Protein expression pattern in C. difficile following the in vivo incubation. Protein expression after 4, 8, and 12 h in vivo incubation is compared with that of ex vivo growth. Rank normalized data from biological and technical replicates were used to create a heatmap for C. difficile. The proteins were arranged according to the numbering of the C. difficile 630 coding sequences, with CD0001 at the top and CD3680 at the bottom, followed by proteins from the plasmid pCD630 (CDP01 to CDP11). Each column represents a particular time point in one iTRAQ experiment, and each row corresponds to a specific protein. The status of each protein is indicated by color as follows: red, induced; green, repressed; black, unchanged; and gray, undetected in our conditions.

