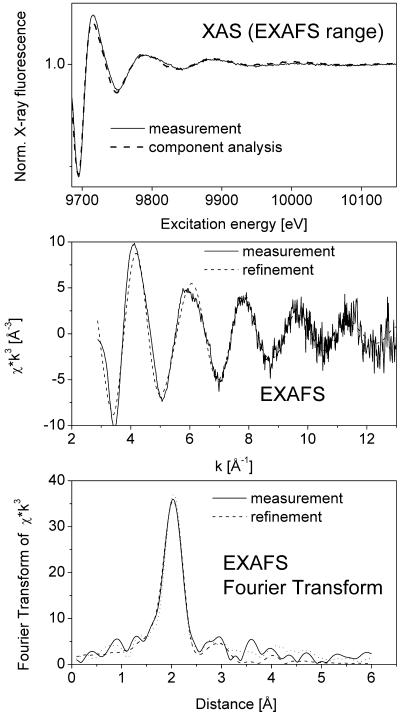
Figure 3.
Typical example of data obtained by in situ x-ray absorbance measurements (Zn edge) of frozen hydrated T. caerulescens tissues. This example represents a measurement of Zn-EXAFS in a young leaf. Top, Raw data after normalization and fit with data sets of model compounds (see Table II). Note that x-ray absorbance was measured as an excitation spectrum of x-ray fluorescence. Middle, Normalized EXAFS and fit with theoretical model. Bottom, Fourier transform of the EXAFS and fits with theoretical model (done on normalized EXAFS) and fit with data sets of model compounds.

