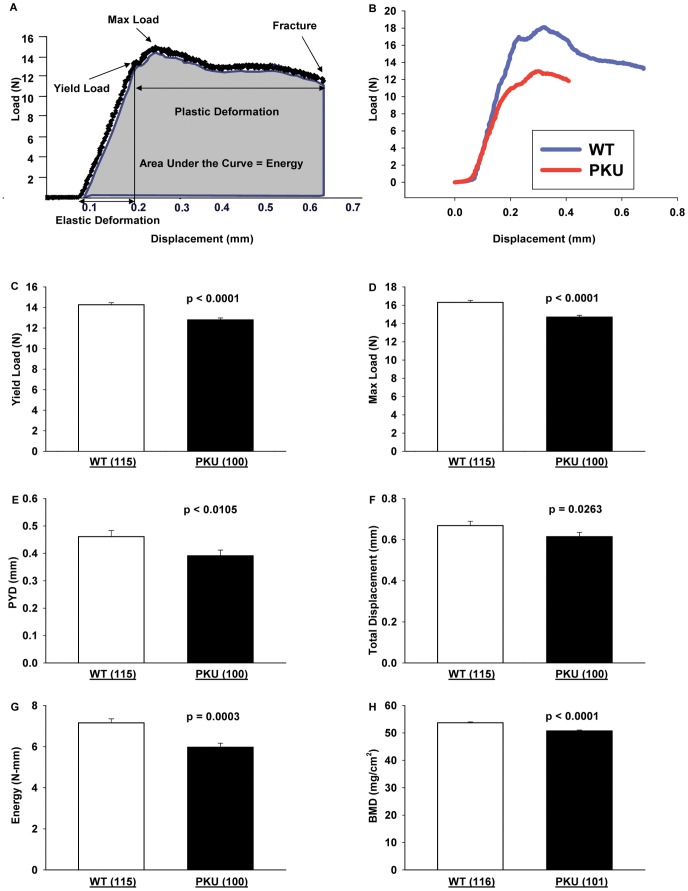
Figure 2. Force-displacement curve analysis of WT and PKU mice.
Schematic of a load-displacement curve generated from the three-point bending test from which the yield point, maximum load, elastic and plastic deformation, and energy to failure (shaded area under the curve) are obtained (A). Representative load-displacement curves for WT and PKU mice (B). Effects in WT and PKU mice for yield load (C), maximum load (D), post-yield displacement (PYD) (E), total displacement (F), energy to failure (G), and femoral bone mineral density (BMD) (H). Values are means ± SE; p-values represent main effect of genotype. Sample size is shown in parenthesis. All values for femoral biomechanical performance had a significant main effect for genotype, WT >PKU.

