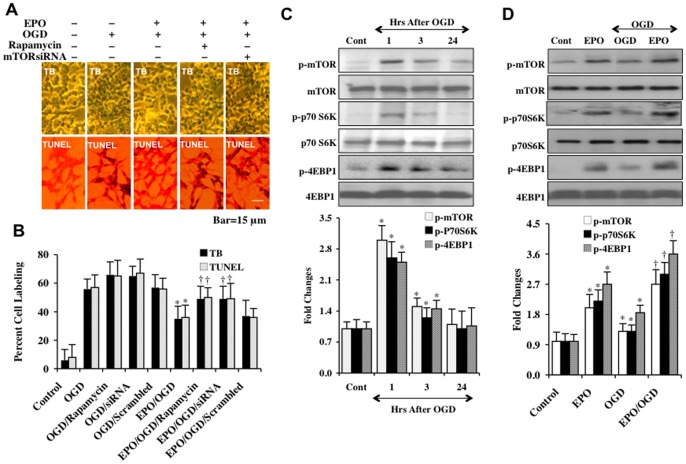
Figure 1. EPO promotes cellular protection through mTOR activation and phosphorylation of p70S6K and 4EBP1.
(A) EPO (10 ng/ml) was applied to SH-SY5Y cultures 1 hour prior to a 6 hour-period of OGD and cell survival and DNA fragmentation was determined 24 hours later through trypan blue dye exclusion (TB) and TUNEL assay. Representative images show that EPO significantly reduces trypan blue and TUNEL staining following OGD. However, application of the mTOR inhibitor rapamycin (50 nM) or transfection of mTOR siRNA prior to EPO administration resulted in the loss of EPO cytoprotection during OGD. (B) Quantitative results illustrate that EPO (10 ng/ml) significantly reduces percent cell staining of trypan blue (TB) and TUNEL in SH-SY5Y cells 24 hours following OGD. Rapamycin (50 nM) or mTOR siRNA transfection prior to OGD attenuated the ability of EPO to offer cytoprotection during OGD leading to an increase in the percent staining of trypan blue and TUNEL. Transfection of scrambled siRNA did not alter EPO cytoprotection or cell injury when compared to treatment with EPO or OGD alone (*P<0.01 vs. OGD; † P<0.01 vs. EPO/OGD). For B, each data point represents the mean and SD from 6 experiments. (C) Western blot was performed for phosphorylated (p-) mTOR (p-mTOR, Ser2448), phosphorylated (p-)-p70S6K (p-p70S6K, Thr389), phosphorylated (p-)-4EBP1 (p-4EBP1, Ser65/Thr70) in SH-SY5Y cells at 1, 3, or 24 hours (Hrs) following a 6 hour period of OGD exposure. OGD resulted in a transient increase in the expression of p-mTOR, p-p70S6K, and p-4EBP1 at 1 and 3 hours (*P<0.01 vs. Control). (D) EPO (10 ng/ml) administration to SH-SY5Y cells significantly increased the expression of p-mTOR, p-p70S6K, and p-4EBP1 3 hours later. EPO (10 ng/ml) applied to SH-SY5Y cells 1 hour prior to a 6 hour period of OGD significantly increased the expression of p-mTOR, p-p70S6K, and p-4EBP1 3 hours following OGD when compared to OGD treated alone (*P<0.01 vs. untreated control; † P<0.01 vs. OGD treated alone). For C and D, Cont = Control and each data point represents the mean and SD from 3 experiments.

