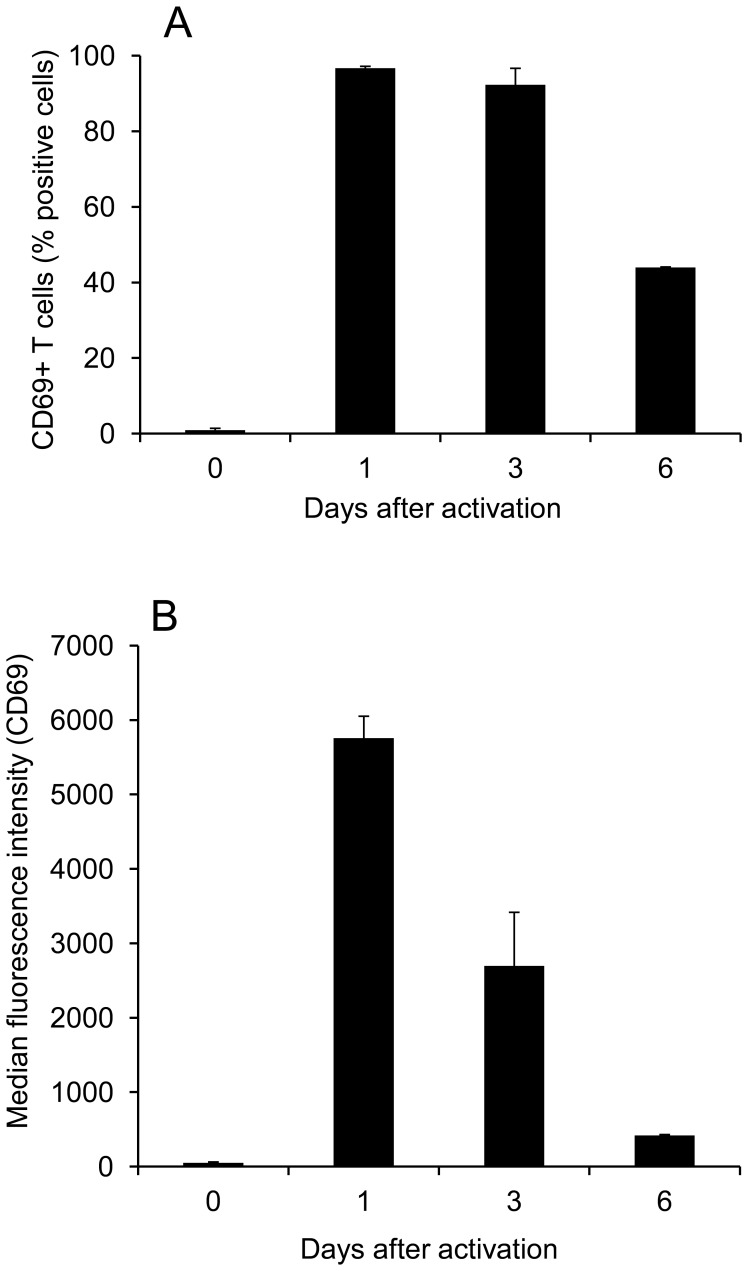
Figure 4. Dynamics of CD69 expression following T cell activation.
Resting T cells were loaded with CFSE or not then either left at rest or stimulated with CD3/CD28 beads for 1, 3 or 6 days. The cells were then stained with a CD69 monoclonal antibody or with an isotype-matched control before flow cytometry. (A) Graph showing the percentage of T cells that were CD69-positive (excess specific staining over isotype) at each time-point. Data are representative of 2 or 3 independent experiments. (B) Graph showing the median fluorescence intensity (MFI) of CD69 staining of T cells at each time-point. Data are representative of two independent experiments.

