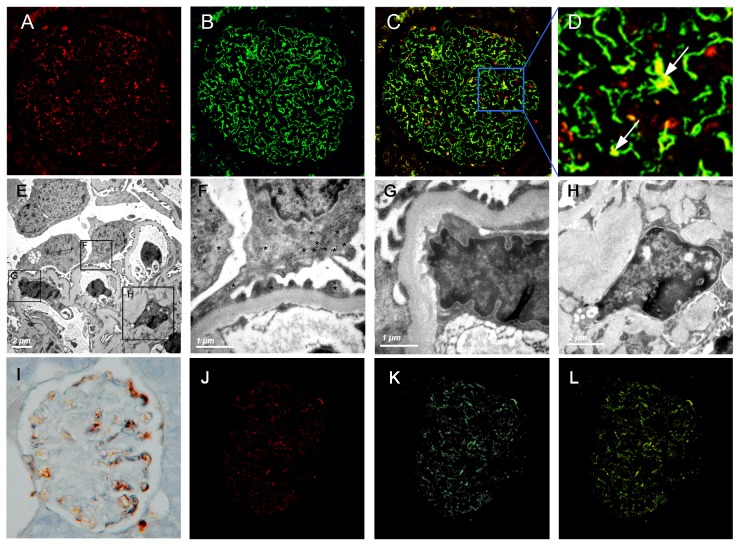
Figure 2. Characterization of H-FABP expression in patients with ORG and in db/db mice.
A–D: ORG-affected kidney sections were examined for expression of H-FABP by immunofluorescence and confocal analysis: (A) H-FABP in red; (B) synaptopodin in green; (C) merge with original magnification ×400 and (D) merge with original magnification ×1640. It was clearly shown that H-FABP was co-localized with synaptopodin in cases of ORG, which is pointed to with white arrows. E–H: Immunoelectronic analysis was conducted to test the pattern of H-FABP expression, and staining was detected by H-FABP (E, *, ×8,000) in the foot process and the cytoplasm of podocytes (F, ×∼40,000), but not in the endothelial cell (G, ×∼40,000) or the mesangial areas (H, ×∼20,000). I: mouse H-FABP expression was examined by double immunohistological analysis in 20 week db/db mice, presenting H-FABP (in yellow), synaptopodin (in blue) and co-located (in black) staining. J–L: mouse H-FABP expression was examined by double immunofluorescence and confocal analysis in 20 week db/db mice: (J) H-FABP in red; (K) synaptopodin in green; and (L) merge showing co-localization in yellow.

