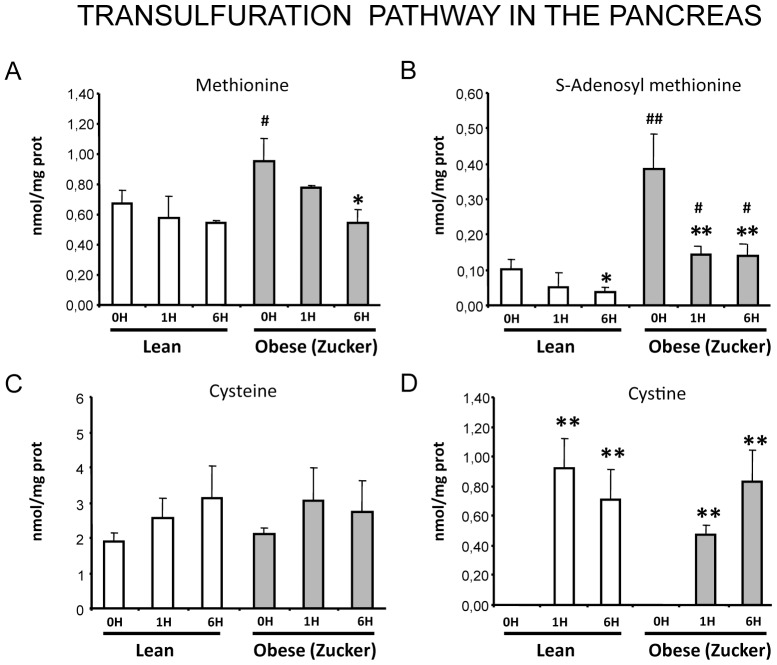
Figure 3. Characterization of the transulfuration pathway in the pancreas in acute pancreatitis.
Levels of methionine (A), S-adenosyl methionine (B), cysteine (C) and cystine (D) in lean and obese (Zucker) rats at 0, 1 and 6 hours after induction of acute pancreatitis. The number of rats per group was 8 for lean rats sacrificed at 0 or 6 h and for obese rats sacrificed at 0 h, 10 for obese rats sacrificed at 6 h, and 4 for lean and obese rats sacrificed at 1 h. The statistical difference is indicated as follows: * P<0.05 and ** P<0.01 vs. time “0”. # P<0.05 and ## P<0.01 in obese vs. lean in the same conditions.

