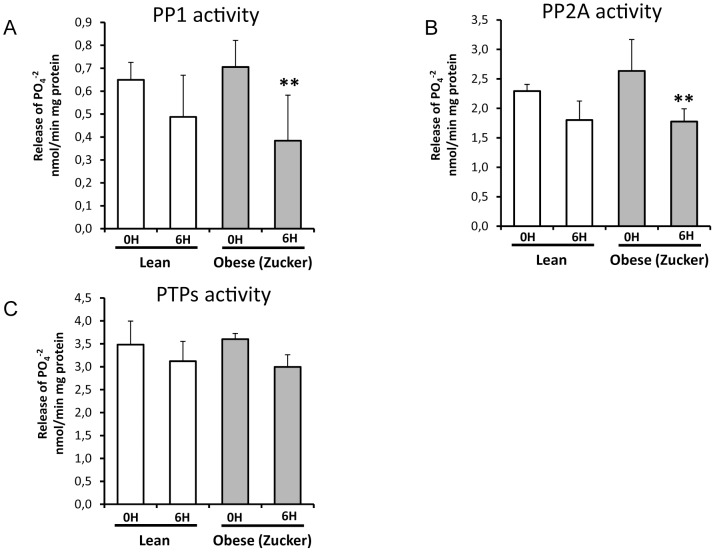
Figure 4. Phosphatase activity in lean and obese rats at 0 and 6 hours after induction of acute pancreatitis.
Serine/threonine protein phosphatases activity -PP1 (A) and PP2A (B)- and tyrosin phosphatases (PTPs) activity (C) are shown as release of PO4 −2 per min. Results are normalized by miligrams of protein. The number of rats per group was 6 for lean rats sacrificed at 0 or 6 h, and 7 for obese (Zucker) rats sacrificed at 0 h or 6 h. The statistical difference is indicated as follows: ** P<0.01 vs. time “0”.

