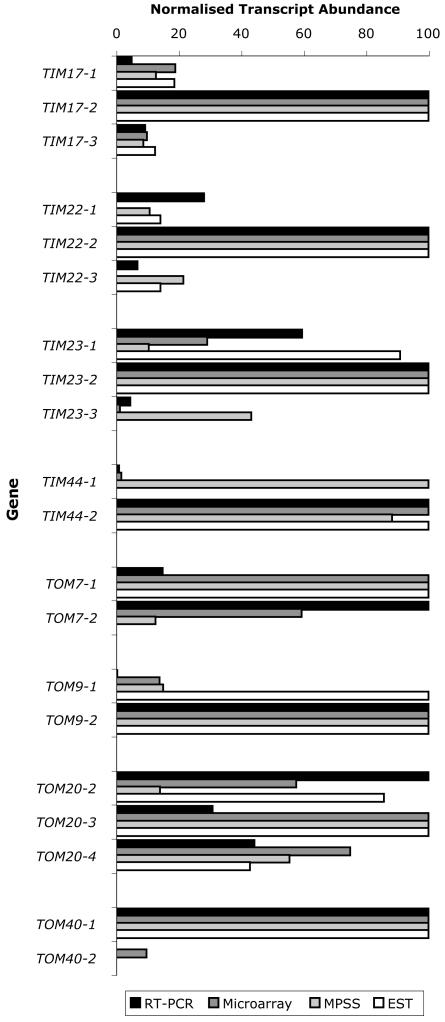
Figure 3.
Comparison of quantitative real-time RT-PCR, microarray, MPSS, and EST data. For each experimental approach, the transcript abundance of every gene was averaged over the different tissue types, then within each gene family, these average message levels of the different isoforms were normalized, with the most abundant isoform given the arbitrary value of 100. EST numbers and microarray signal values (from control arrays) within each gene family were normalized against the isoform with the highest transcript abundance, allowing comparison of EST and microarray values in each gene family with real-time RT-PCR and MPSS data.

