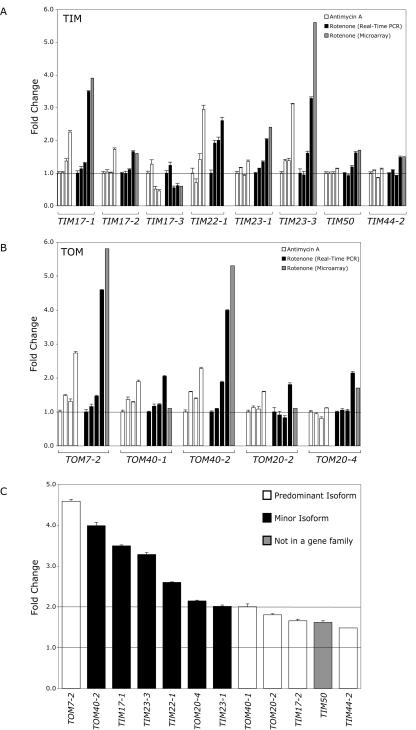
Figure 4.
Changes in import component transcript abundance over time after treatment with mitochondrial electron transport chain inhibitors. Transcript abundance of import components were measured by quantitative real-time PCR at 0, 1, 3, and 12 h after treatment of Arabidopsis cell culture with 5 μm antimycin A or 40 μm rotenone. The fold change in transcripts of TIM components (A) and TOM components (B), which changed significantly in comparison with the transcript abundance in control cells over the same period. The fold change measured by microarray analysis after 12 h of rotenone treatment is shown (M). C, Comparison of the increase in transcript abundance of minor (indicated in black) and predominant (indicated in white) import component isoforms after 12 h of rotenone treatment as measured by quantitative real-time PCR.

