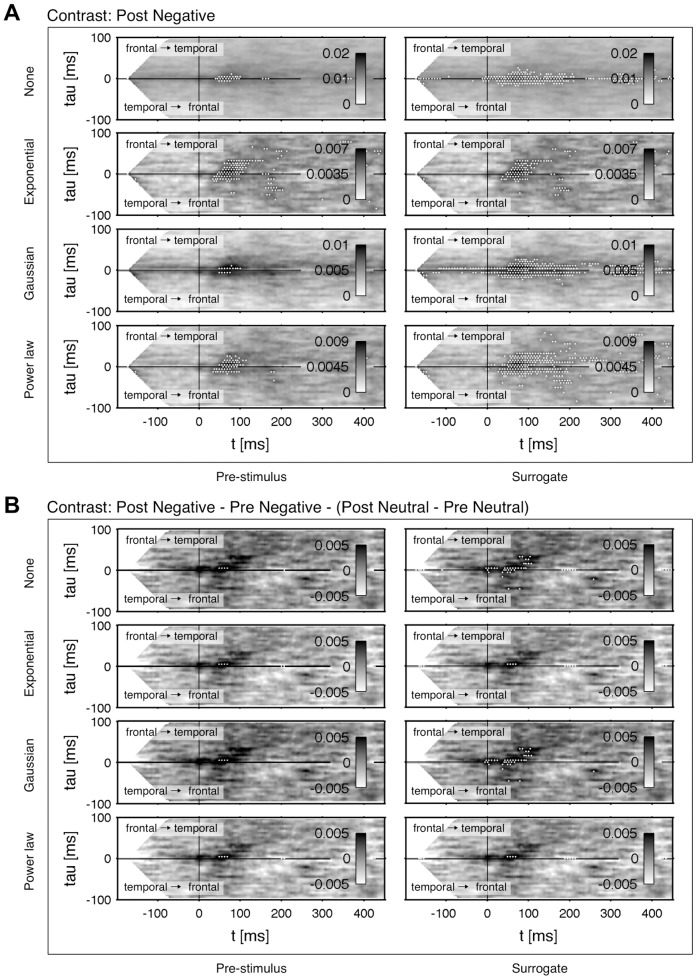
Figure 11. Impact of different types of de-correlations and baselines on a) the connectivity pattern Post Negative and b) the contrast Post Negative - Pre Negative - (Post Neutral - Pre Neutral).
Four types of de-correlation were implemented: None without any de-correlation, Exponential with  , Gaussian with
  and Power law with
  . Data from the interval
  –0 ms provides a baseline for the FDR threshold in Pre-Stimulus. As an alternative approach Surrogate data was estimated by destroying correlation in phases. Significant higher connectivities are marked by white dots.

