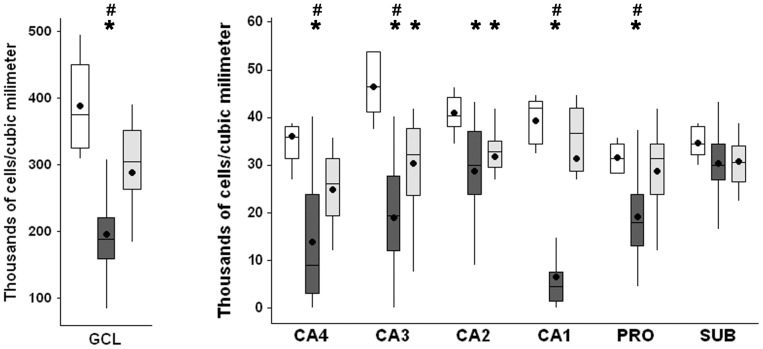
Figure 3. Neuronal density in hippocampal subfields of Ctrl, MTLE and TLE-TD groups.
MTLE (dark gray boxplots) had reduced neuronal density (showed as thousands of cells per cubic millimeter), when compared to Ctrl (white boxplots) and TLE-TD (light gray boxplots), in granule cell layer (GCL), CA4, CA3, CA1 and prosubiculum, and in CA2, when compared to Ctrl (p<0.001). TLE-TD presented decreased neuronal density only in CA3 and CA2, compared to Ctrl (p<0.001). The * indicate difference from Ctrl and # difference from TLE-TD. The dark circles indicate mean.

