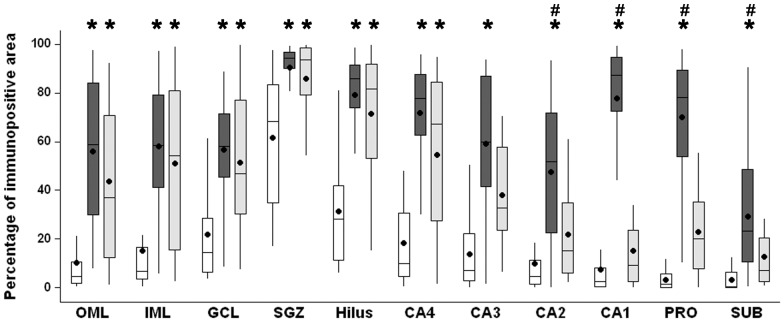
Figure 5. GFAP immunopositive area in hippocampal subfields of Ctrl, MTLE and TLE-TD groups.
Compared to Ctrl (white boxplots), MTLE (dark gray boxplots) and TLE-TD (light gray boxplots) groups had increased GFAP immunoreactivity (showed as percentage of immunopositive area) in outer molecular layer (OML), inner molecular layer (IML), granule cell layer (GCL), subgranule zone (SGZ), hilus, CA4 and CA3 (p<0.001), and MTLE groups had increased GFAP immunopositivity in CA2, CA1, prosubiculum (PRO) and subiculum (SUB), compared to Ctrl and TLE-TD (p<0.001). In the subiculum (SUB), TLE-TD had increased GFAP immunoreactivity, compared to Ctrl (p<0.001). The * indicate difference from Ctrl and # difference from TLE-TD.

