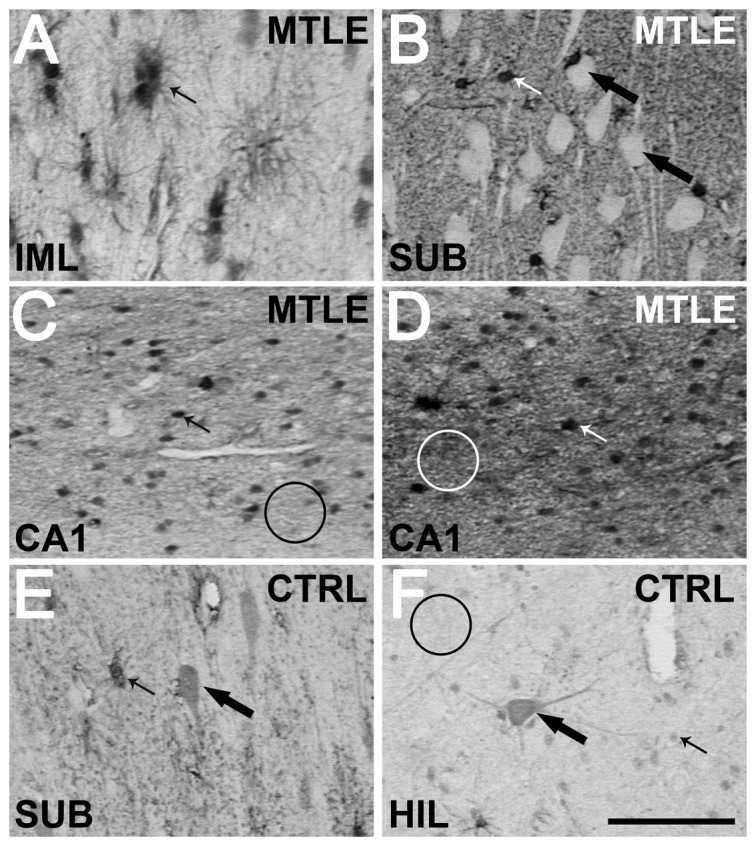
Figure 7. Representative images of MT-I/II staining in several hippocampal subfields.

Almost all stained cells have astrocyte morphology (indicated by small arrows in A–F), while neurons remained unstained (white cells pointed by large arrows in B). Only in few cases from Ctrl (E and F) and in one region of one case of TLE were observed cells with neuron morphology (large arrows in E and F). No stained neuron presented the strong staining of astrocytes. In Ctrl, neuropil presented a weak staining (indicated by black circle in F). In TLE the neuropil staining level was heterogeneous, as can be seen in CA1 sections depicted in C and D (indicated by white circles). The representative images shown are from the fascia dentate (A), subiculum (B and E), CA1 (C and D) and hilus (F) of Ctrl (E and F) and TLE cases (A–D). Bar in F indicates 100 micrometers.
